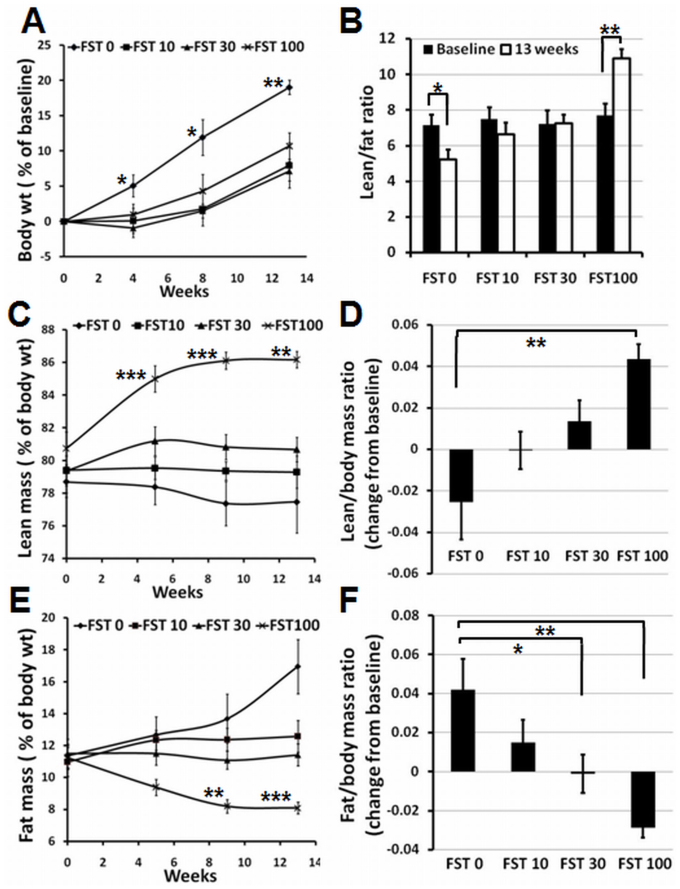
Figure 3. Growth and change in body composition in response to FST288 administration to mice.
(A) Time course of the average body weight from all four groups, as indicated, represented as the percent of baseline. (B) Lean mass/fat mass ratio of animals, as indicated, after 13 weeks of treatment with FST288. (C & E) Time courses of lean mass and fat mass measurement, respectively, during the period of FST288 administration, plotted as the percent of body weight. (D & F) Lean mass/body mass and fat mass/body mass, respectively, of animals, as indicated, after 13 weeks of administration of FST288, plotted as the change (difference) from the baseline values. *, ** and *** indicate p < 0.05, <0.01 and <0.001, respectively. p-value measurements in A, C and E are between FST 0 and FST 100.

