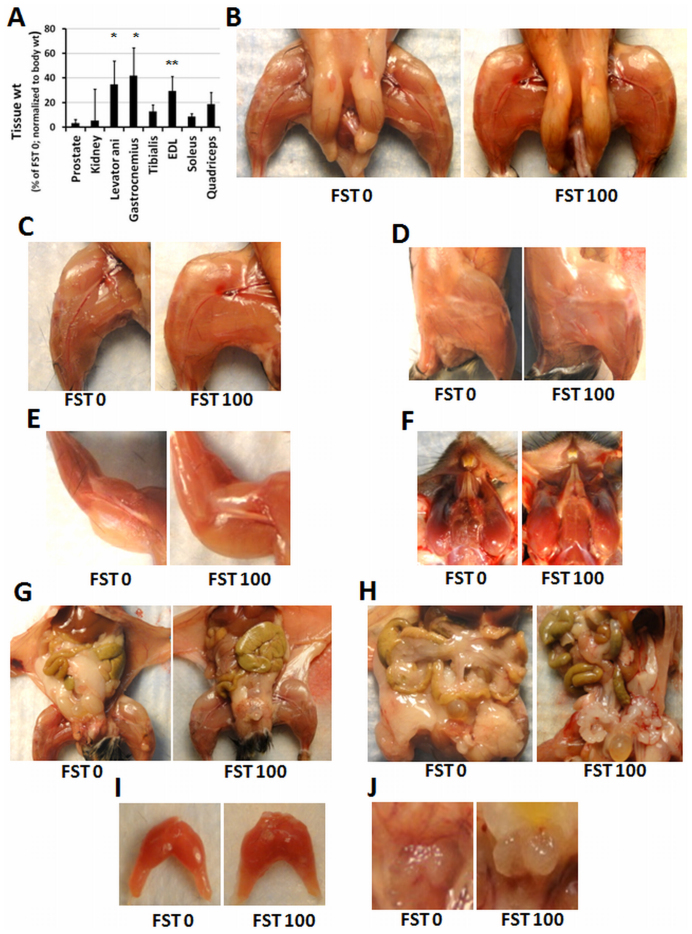
Figure 4. Post-mortem observation of muscles and organs.
(A) Average weights of the dissected tissue, as indicated, of the FST 100 group presented as the percent of the FST 0 group (normalized to body weight). * and ** indicate p < 0.05 and <0.01, respectively. Pictures of lower limb (B, C and D), upper limb (E), facial (F), abdomen (G) abdominal visceral fat (H), dissected levator ani (I) and prostate (J) representing control (FST 0) and FST 100 groups, as indicated.

