
Figure 2.
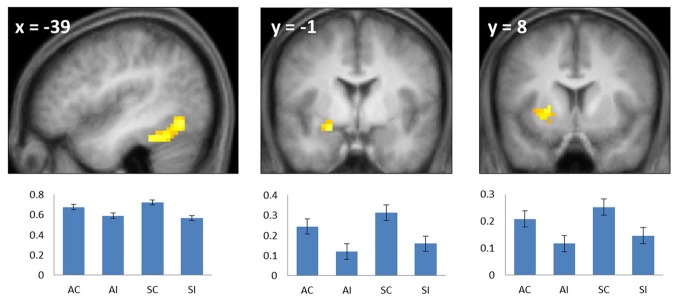
Common subsequent memory effects. Bar plots show mean parameter estimates (left to right) for the four conditions of interest (AC, associative correct; AI, associative incorrect; SC, source correct; SI, source incorrect) for peak voxels in the left fusiform (left), left anterior hippocampus/amygdala (center), and left putamen (right). Results are overlaid onto sections of the across-subjects mean T1-weighted anatomical image (note—in this and subsequent figures, the mean image is derived from only 19 of the 20 included subjects, because of the corruption of one subject's anatomical data). Error bars here and in the following figures signify the standard error of the mean derived from the error term of the one-way ANOVA (Loftus and Masson, 1994).