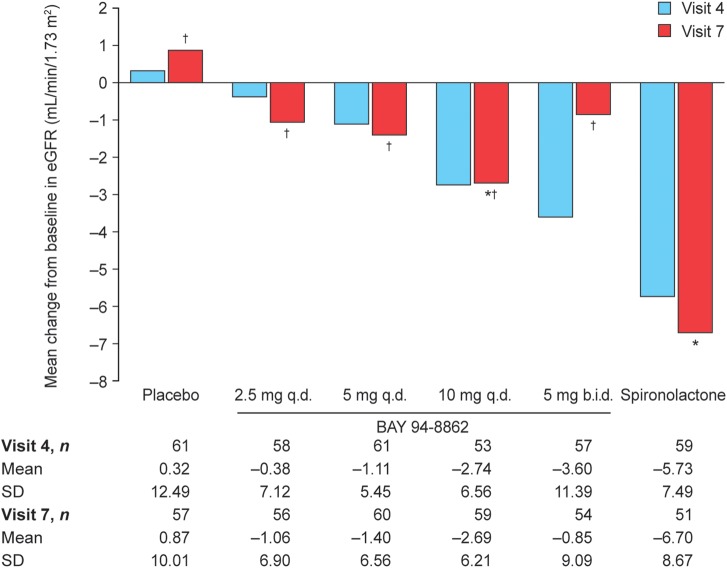
Figure 3.
Mean change from baseline to visit 4 (day 15 ± 1) and visit 7 (day 29 ± 2) in the estimated glomerular filtration rate (eGFR), as calculated using the modification of diet in renal disease formula, in patients receiving BAY 94-8862, placebo, or spironolactone in the safety analysis set of part B of ARTS. *P < 0.05 compared with the placebo group at visit 6/7; †P < 0.05 compared with the spironolactone group at visit 6/7. Significance of visit 4 data was not analysed. b.i.d., twice daily; q.d., once daily; SD, standard deviation.

