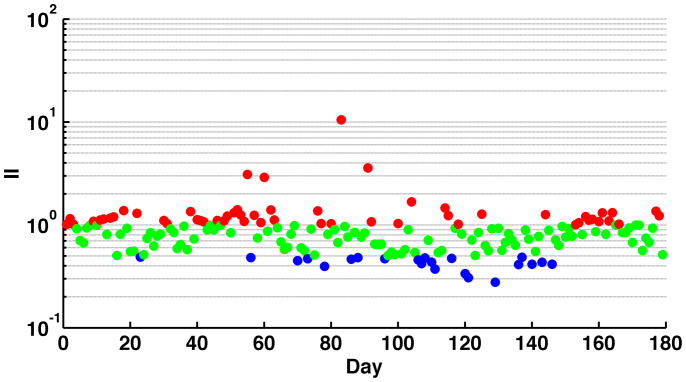
Figure 5. We calculate the ratio between the number of stocks influenced by the synthetic index and the number of stocks influenced by the market index.
The x-axis is days in which there was a nonzero influence, and the y-axis is the value of the II, in a logarithmic scale. The days are color-coded: blue, II ≤ 0.5; green, 0.5 < II ≤ 1.0; and red, II > 1.0.

