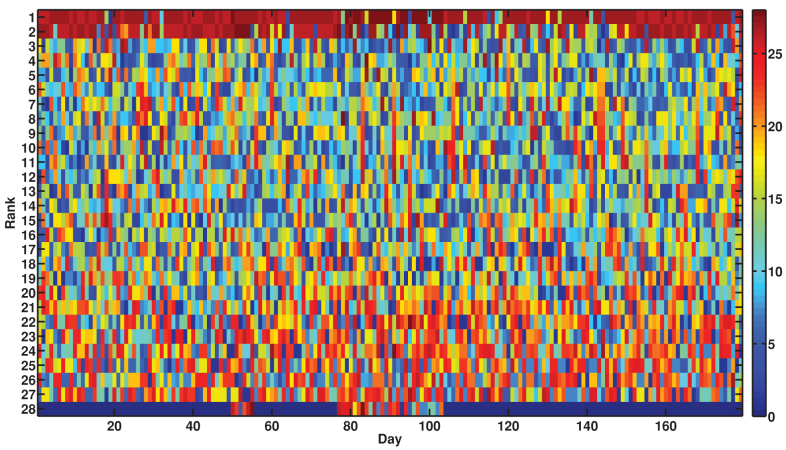
Figure 6. Ranking of stocks and indices, according to their influence, for each day.
The color represents the number of the stock/index, where for the majority of the days there were 25 stocks, and then the synthetic index was number 26, and the market index was 27. For a small percentage of the days, there were 26 stocks, and then the indices were numbered 27 and 28, respectively.

