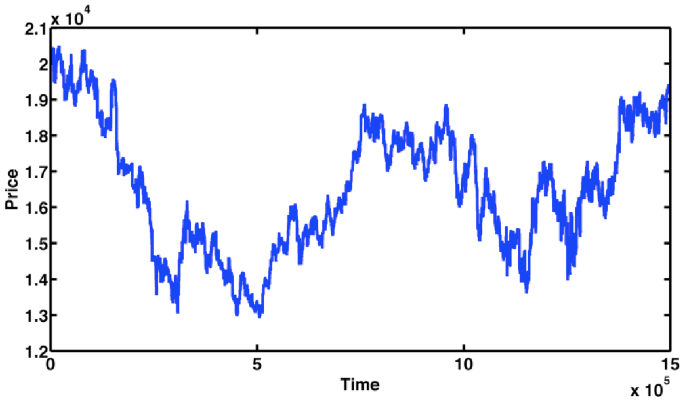
Figure 7. Interday price change of TEVA for the trade period 2006–2010.
The time axis (x-axis) is time in the sense of transactions, starting from 1.0 at the beginning of the continuous trade stage for the first trading day (01/01/2006) until the end of the continuous trade stage of the last trading day (31/12/2009).

