Figure 6.

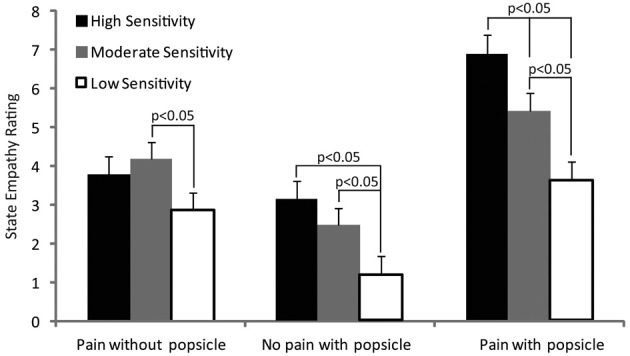
The figure shows the mean state empathy ratings for each tooth sensitivity group in response to each image. Post-hoc significant differences are indicated.

The figure shows the mean state empathy ratings for each tooth sensitivity group in response to each image. Post-hoc significant differences are indicated.