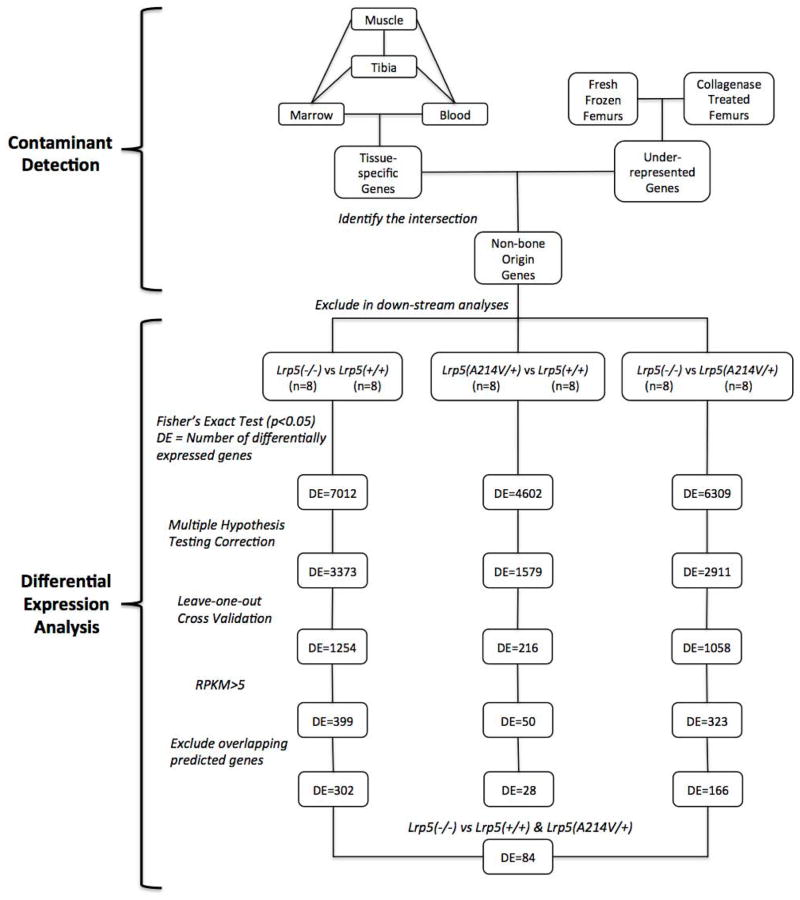
Figure 4. Overview of data filtering and analysis pipeline.
A list of contaminating transcripts (n = ~900) was compiled based upon tissue-specific expression profiling and transcript abundances in collagenase-digested versus fresh-frozen bone samples. Transcripts representing the genes on this list were in silico filtered from the diaphyseal bone RNA-seq data prior to downstream analyses. In each statistical comparison, p-values were computed with Fisher’s Exact test (with significance set at p < 0.05) and corrected for multiple hypothesis testing (false discovery rate < 0.05), grouped samples were subjected to leave-one-out cross validation, and genes expressed below the detectability threshold (RPKM<5) were eliminated. The numbers of differentially expressed (DE) genes remaining after each step are noted. Lastly, predicted genes, non-coding RNAs and microRNAs that overlapped with the introns of highly expressed protein coding genes were eliminated in order to ensure that the reads mapped to these regions due to incomplete transcription events were not registered in differential expression calculations. A comparison between RNA-seq data from the tibia diaphyseal bones of LRP5 sufficient (Lrp5p.A214V/+ and Lrp5+/+) and insufficient (Lrp5−/−) mice yielded 84 differentially expressed protein-coding genes.

