
Fig. 2.
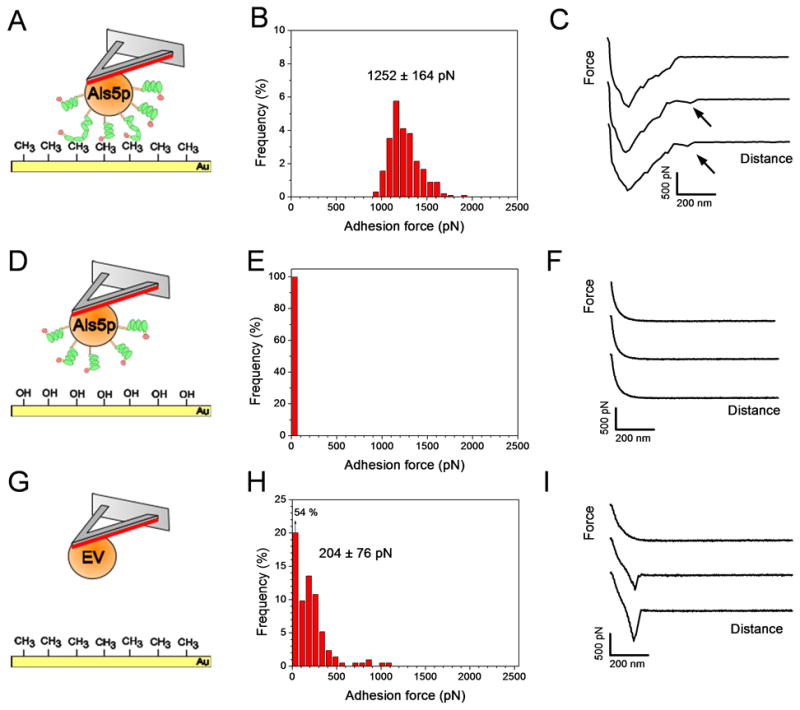
Measuring Als5p-mediated hydrophobic forces. (A, D, G) Schemes of the experimental set-ups in which the TR and Ig regions of Als5p are shown in green and red, respectively. (B, E, H) Adhesion force histograms (n = 1024 force curves) and (C, F, I) representative retraction force curves recorded in deionized water between single S. cerevisiae cells expressing Als5p proteins and hydrophobic (CH3) (A–C) or hydrophilic (OH) (D–F) substrates, and between single S. cerevisiae cells lacking Als5p (EV) and hydrophobic substrates (G–I). Adhesion force values used to build the histograms correspond to the largest adhesion events seen in the curves. Arrows in Fig. 2c indicate that large adhesion signatures were followed by weaker events rupturing at ~500 nm. The contact time was 350 ms. For each condition, similar data were obtained using at least 3 different cells from independent cultures and 3 different substrates.