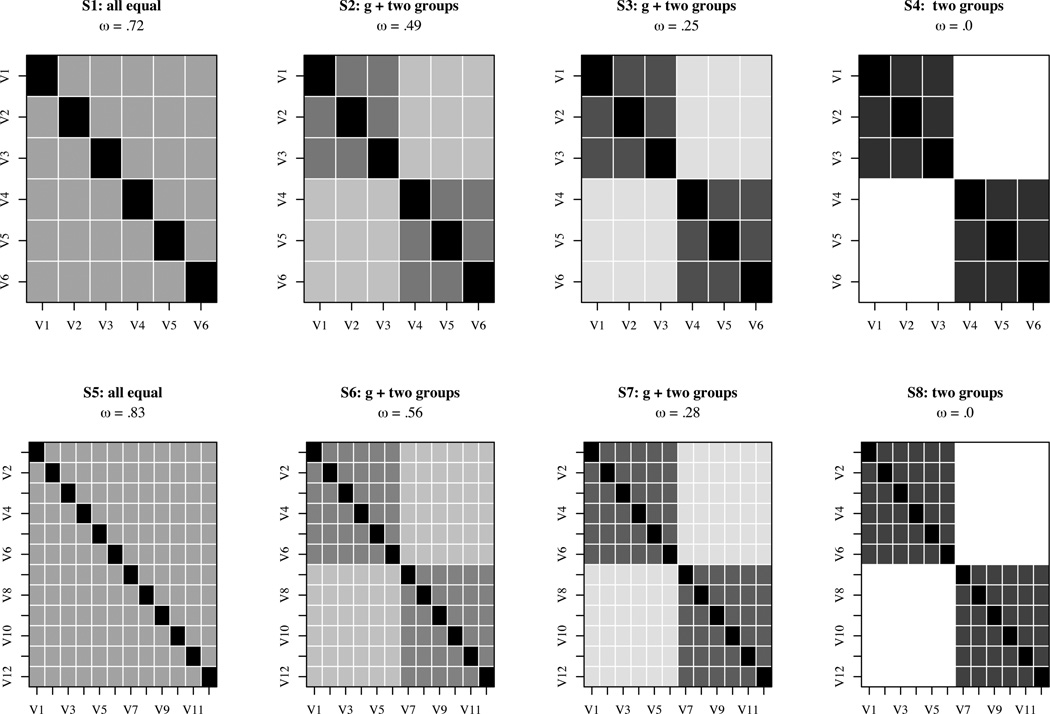
Figure 2.
Examples of a general factor for data sets 1–8. Each figure graphically portrays a correlation matrix with shading representing the magnitude of the correlation. The diagonal is a correlation of 1. The first row shows 6 and the second 12 variables with just a general factor, a large general with two group factors, a small general and two groups, and just two group factors. The average intercorrelation of the items .3 for all eight sets and thus α = .72 for all sets in the first row and α = .84 for all sets in the second row. See Table 2 for a comparison of alternative methods of estimating a general factor for these eight data sets.

