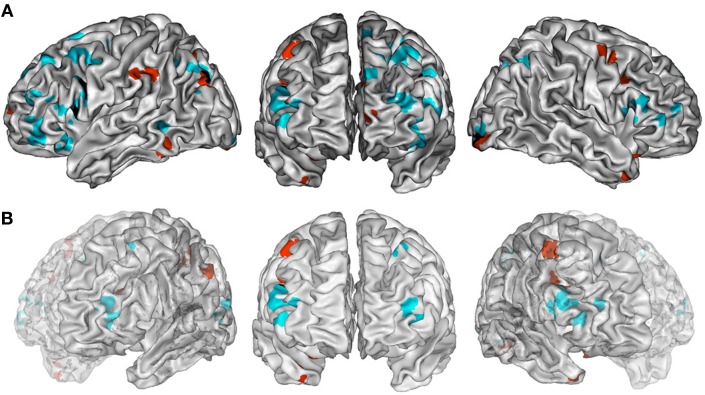
Figure 2.
(A) ALE maps of combination task foci (in cyan) and generation task foci (in red). Overlaps between maps are shown in black. All maps were thresholded at a whole-brain cluster-level corrected p < 0.05. (B) ALE maps resulting from contrast studies of combination vs. generation tasks foci (in cyan) and generation vs. combination task foci (in red). These contrast maps were thresholded at a whole-brain FDR corrected p < 0.05. In (A,B), ALE maps are displayed on a surface rendering of the Colin27 template (Holmes et al., 1998) in the MNI space.

