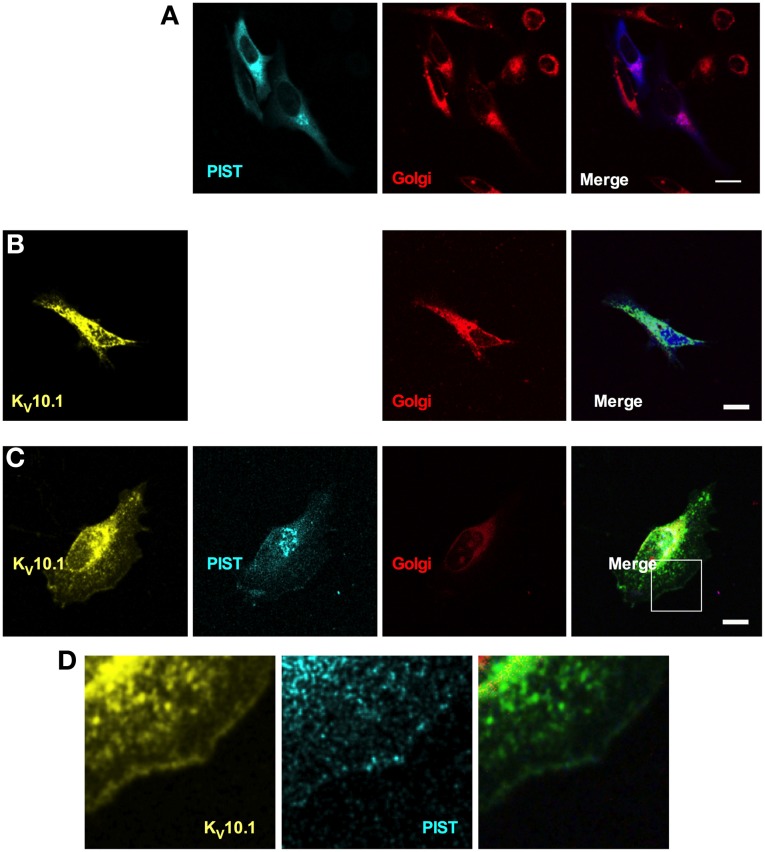
Figure 6.
Cellular distribution of KV10.1_Venus and CFP-tagged PIST. CFP-PIST, when expressed alone (A), reproduced from Figure 5, gave a diffuse distribution with preferential location to the Golgi (stained in red). Overexpressed KV10.1 showed a preferentially intracellular distribution (B). When co-expressed (C), both CFP-PIST and KV10.1 were detectable at the cell periphery, compatible with an increase of membrane localization of both proteins. (D) represents a larger magnification of the area represented by a white square in the “merged” panel in (C), Scale bar: 10 μm.

