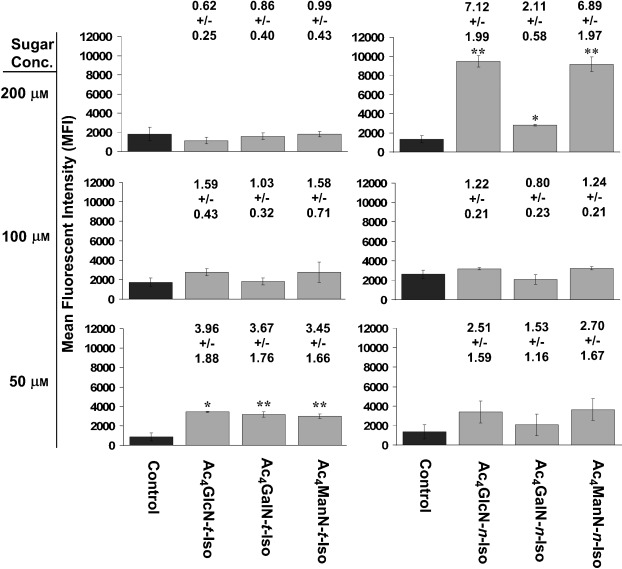
Figure 1.

Flow cytometry results from the two-step labelling procedure. LL2 cells were exposed to either vehicle (DMSO, <0.25% v/v, control) or one of the isonitrile sugars. The mean fluorescence intensity (MFI) of the cells after the labelling procedure is shown. Error bars represent standard deviation of three repeats, 10 000 events per repeat (see Figures S1 and S2 for details). Numbers above bars are the SBRs (sugar MFI/control MFI) and the associated error. *P<0.05, **P<0.005, differences between control and sugar MFI were significant, two-tailed t-test.
