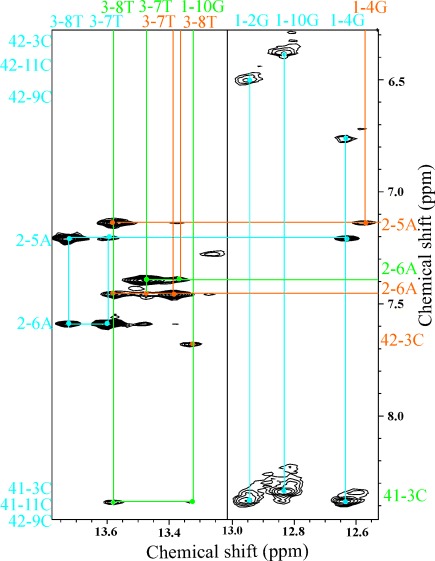
Figure 5.

Imino region of the NOESY spectrum shown in Figure 4. Cross-peak assignments for all three observed DNA strands are given with numbers indicating the position in the base rings, followed by the nucleotide number and type: symmetric DNA (blue), asymmetric DNA with green (α strand) and orange (β strand). Vertical and horizontal lines connect peaks to the assignment texts.
