
Figure 8.
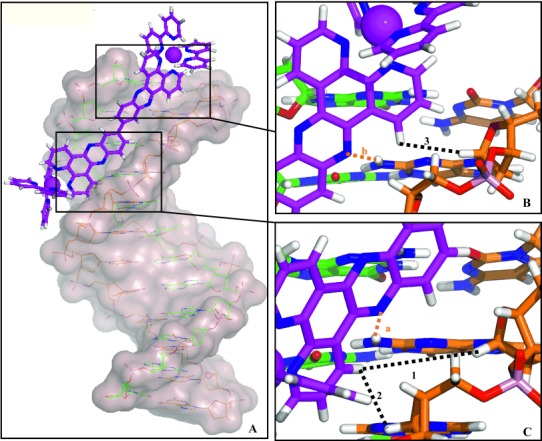
Average DNA–Λ,Λ-B structure of the 5 ns productive, unrestrained trajectory from the same MD simulation as shown in Figure 7. A) Overall side view. B,C) Details of the short distances of three intermolecular NOEs shown in Table 1. Colour coding: green=strand α, orange=strand β. Dotted lines indicate NOEs (black, numbered 1–3) and potential hydrogen bonds (orange, labelled “a” and “b”: Na and N′b of Λ,Λ-B with the amino groups of the guanines bases 4 and 2, respectively.