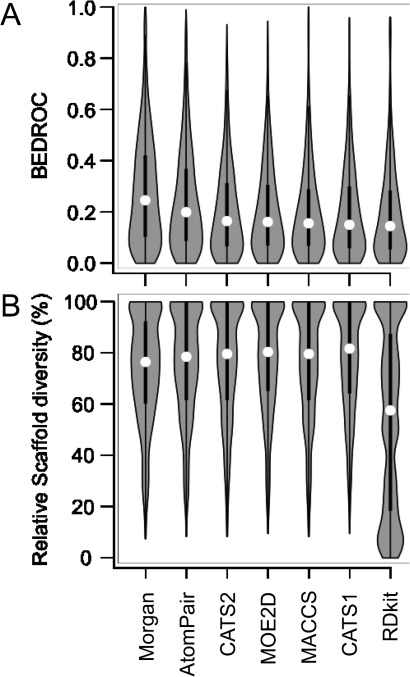
Figure 2.

Comparison of molecular representations for their abilities to retrieve known actives (A) and scaffolds (B) from a collection of druglike bioactive compounds (COBRA). Violin plots show the shapes (gray), medians (white circle) and quartiles (thick lines) of the distributions.
