
Figure 3.
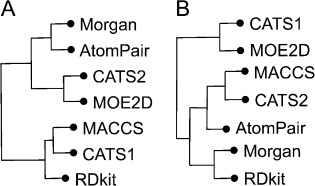
Similarity of molecular representations in terms of their enrichment (A) and scaffold-hopping potential (B). Pair-wise, one-sided Wilcoxon rank sum tests24 were performed for the BEDROC score distributions of the descriptors. Clustering the obtained p-values with Ward’s method25 resulted in the depicted dendrograms.