
Figure 4.
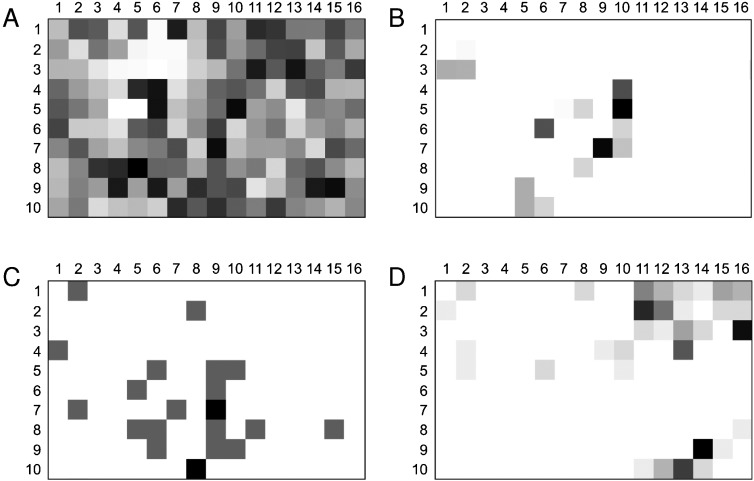
Toroidal self-organizing map (SOM) visualizing overall data density (A), distribution of the virtual combinatorial library (B), known PI3K inhibitors (C), and known muscarinic receptor ligands (D). 16×10 data clusters (‘neurons’, Voronoi fields) are shown as squares. Gray shading represents local compound density (note that the shading in each plot is scaled between minimal and maximal values). Compound 1 is located in cluster (9,7), compound 2 in cluster (10,5). For compound 1 an overlap with PI3K inhibitors is predicted. Compound 2 is found in a cluster that contains muscarinic receptor ligands and few PI3K inhibitors.