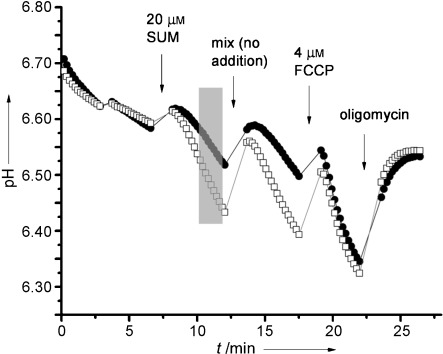
Figure 8.

The addition of MitoDNP-SUM to mitochondria led to different rates of acidification depending on whether the experiment was conducted under low- (•) or high-ROS (□) conditions. The rate of acidification was determined by taking a linear regression of the grey shaded region on the plot. The effect of FCCP is also shown, together with the inhibition of ATP synthase by 1 μg mL−1 oligomycin. Typically an acid calibration addition was made at the end of multiple runs per plate, and the average pH change (∼0.15 pH units) was used to calibrate the data to pmol H+⋅min−1 per μg protein.
