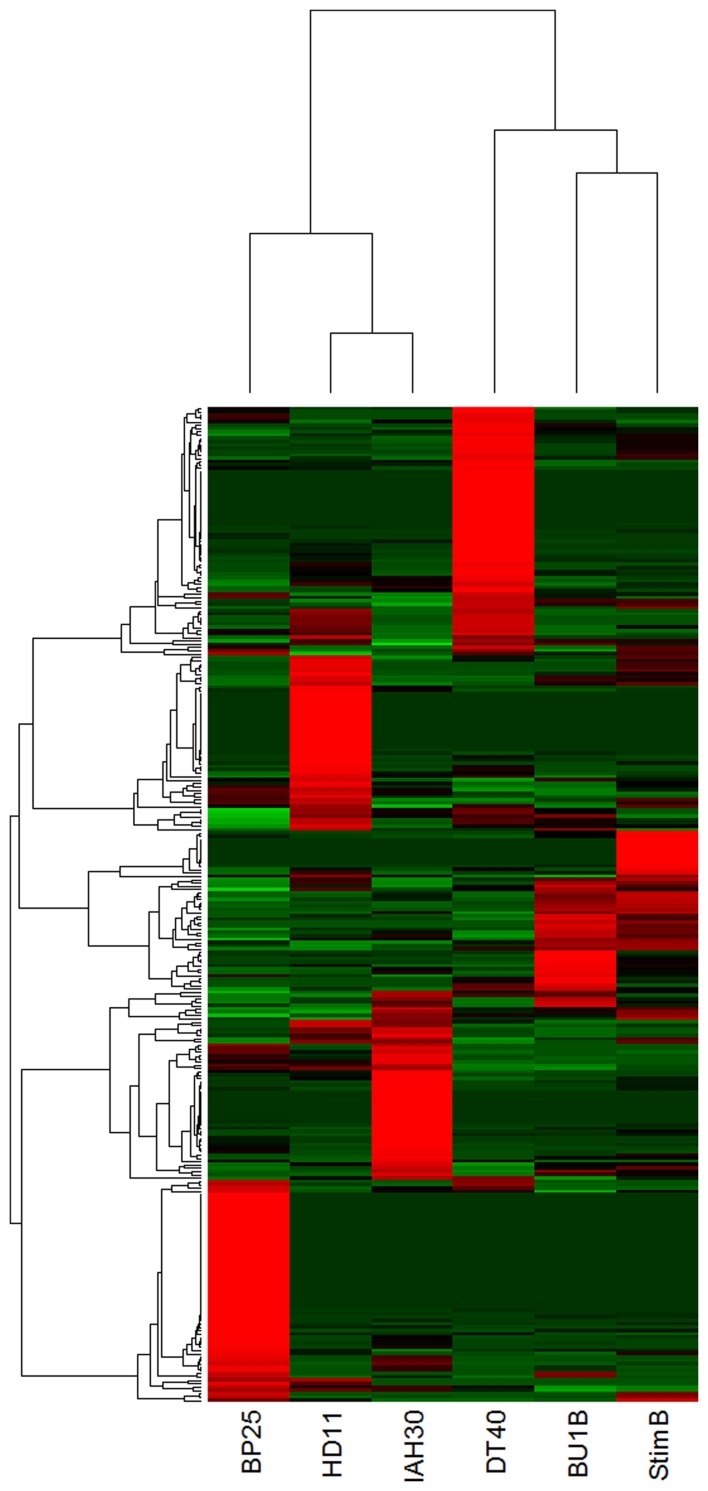
Figure 5.
Heatmap demonstrating differential clustering of the miRNAs from avian cell types based on expression levels calculated from normalized read counts (Red indicates high levels of expression and green to indicate low levels). BP25 is the cESC line BP25 (Pain et al., 1996); BU1B is the naïve embryonic B lymphocyte; DT40 is the data from DT40 cells (Buerstedde et al., 2002); stimB is the CD40L-induced B-cells; HD11 and IAH30 represent HD11 (Beug et al., 1979) and IAH30 (Lawson et al., 2001) cell lines respectively.

