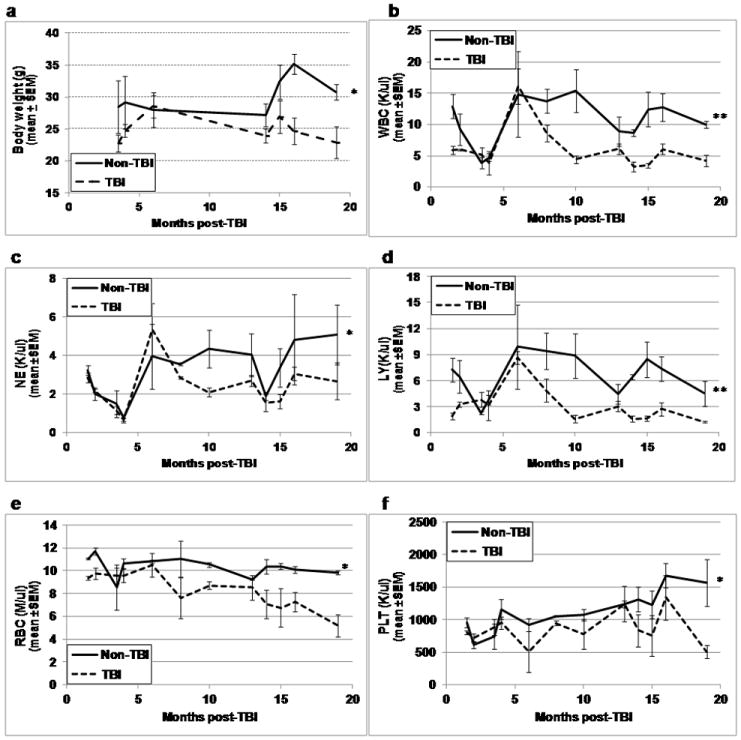
Figure 1. Body weight and CBC profiles in TBI and non-TBI mice.

At various times between 1.5 and 19 months post-exposure, TBI and non-TBI mice were assessed for body weight (panel a), peripheral blood white blood cells (WBC, panel b), neutrophils (NE, panel c), lymphocytes (LY, panel d), red blood cells (RBC, panel e), and platelets (PLT, panel f). Lines represent mean±SEM; *p≤0.01 comparing non-TBI to TBI, **p<0.05 for significant interaction indicating greater difference between TBI and non-TBI at later time points. n=2-3 mice per group per time point.
