
Figure 2. Bone marrow (BM) cellularity and primitive hematopoietic phenotypes in TBI and non-TBI mice.
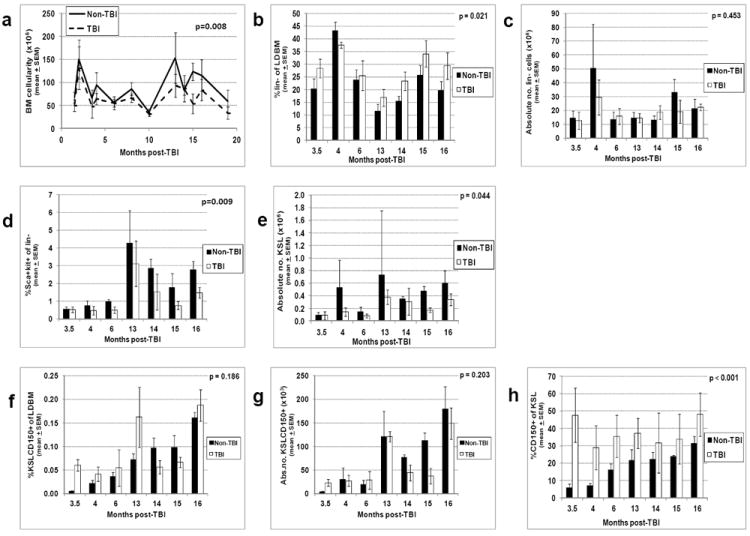
TBI and non-TBI mice were sacrificed at various times post-exposure and LDBM isolated. LDBM was enumerated and absolute numbers of LDBM cells per mouse (BM cellularity) were calculated as described in Materials and Methods (panel a). The percentage of different primitive hematopoietic cell phenotypes was determined by flow cytometry as described in Materials and Methods, and multiplied by BM cellularity in panel a to give the absolute number of these different cells per mouse. The following data are shown: panel b, the percentage of lineage-negative cells; panel c, the absolute number of lineage-negative cells per mouse; panel d, the percentage of Sca-1+ c-Kit+ cells on lin- cells; panel e, the absolute number of KSL per mouse; panel f, the percentage of KSLCD150+ cells; panel g, the absolute number of KSLCD150+ cells per mouse; panel h, the percentage of CD150+ cells within the KSL population. Phenotyping of bone marrow cells at month 19 post-TBI could not be performed due to limiting numbers of cells isolated at this time point. Bars represent mean±SEM; p values comparing non-TBI to TBI are given on each figure. n=3 mice per group per time point.