
Figure 7. Content of reactive oxygen species (ROS) in TBI and non-TBI bone marrow KSL cells.
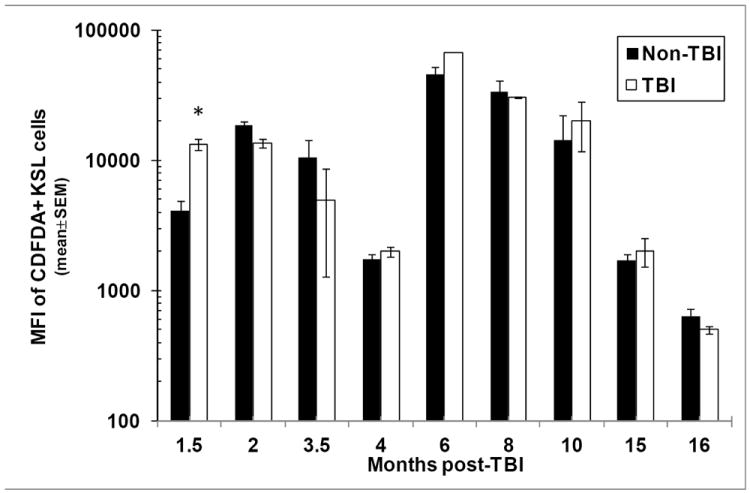
TBI and non-TBI mice were sacrificed at various times between 1.5 and 16 months post-exposure and bone marrow KSL cells were analyzed by flow cytometry for ROS content using C-DFDA. Bars represent the mean±SEM of the mean fluorescence intensity (MFI) of C-DFDA on C-DFDA+ KSL cells; *p<0.05 comparing TBI and non-TBI C-DFDA+ KSL cells at 1.5 months post-exposure. n=2-3 mice per group per time point.