Figure 1.

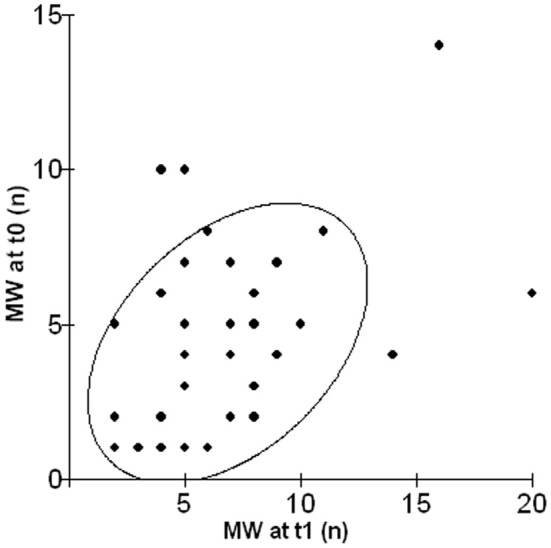
Scatterplot illustrating the relationship between the number of episodes of MW in the lab (MW at t0) and in daily life after 1 year (MW at t1).

Scatterplot illustrating the relationship between the number of episodes of MW in the lab (MW at t0) and in daily life after 1 year (MW at t1).