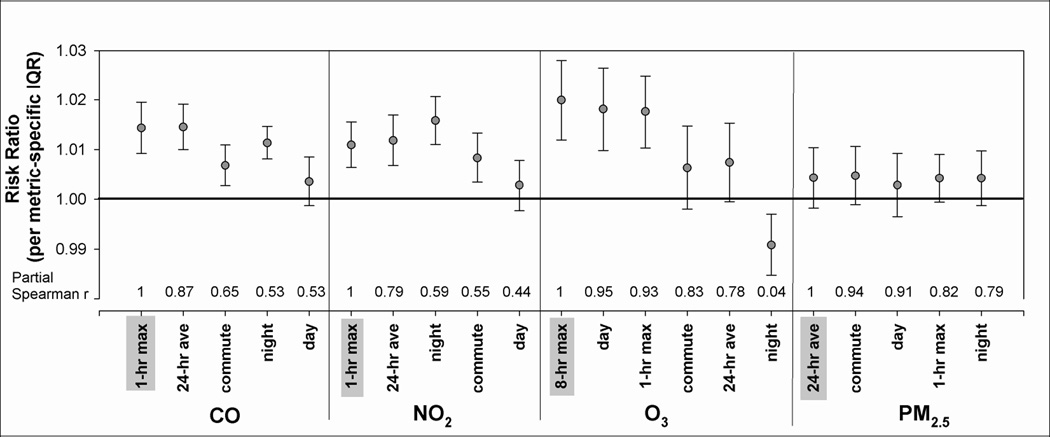
Figure 3.
Risk ratios and 95% confidence intervals* for associations between lag 1 pollutant metrics and respiratory emergency department visits. Partial spearman correlations between a priori metrics (shaded in grey) and other pollutant metrics shown above x-axis.
* RRs scaled to the interquartile range of each metric

