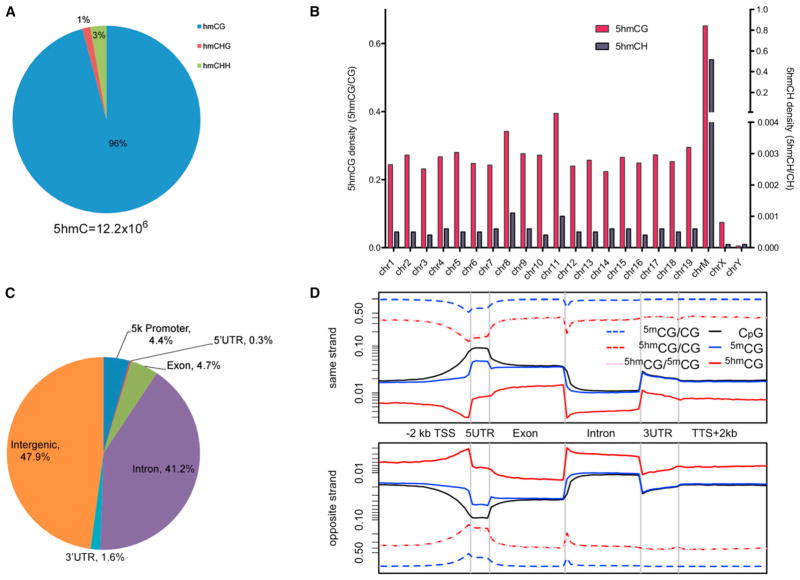
Figure 2. Genomic View of the Mouse ESC Hydroxymethylome.
(A) Distribution of 5hmCG and 5hmCH sites in ESCs.
(B) 5hmCG (left y axis) and 5hmCH (right y axis) site densities by each chromosome.
(C) Distribution of 5hmC in different genomic elements.
(D) Strand-specific metaplot of normalized 5hmC and 5mC (Stadler et al., 2011) distribution near coding sequences.
See also Figure S2.

