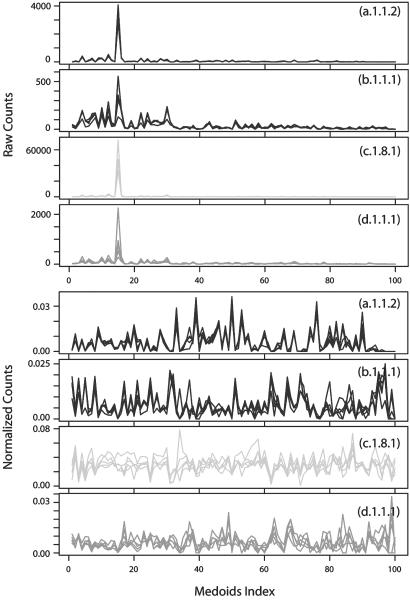
Fig. 4.
LFF profiles of protein structures from the globin family (a.1.1.2), the Ig V set domain family (b.1.1.1), the α-amylases N-terminal domain family (c.1.8.1), and the microbial ribonuclease family (d.1.1.1) in the SCOP database. (upper four plots) The raw counts of LFF are plotted as a function of 100 different representative medoids (shown in Fig. 3) in red, blue, yellow, and green, respectively, of the four protein families. The highest peak in each family corresponds to the medoid index 15 of Fig. 3, which is the “null” medoid submatrix, with all of the matrix elements having a distance >20 Å. LFF profiles for five proteins sampled from each family are shown. The quality of clustering of local features is difficult to discern because of the domination of the null medoid and low signal to noise ratio of the rest of the modoids (lower four plots). However, after normalization by the spread of the counts in each representative medoid, the similarity among LFF profiles within each family is evident.

