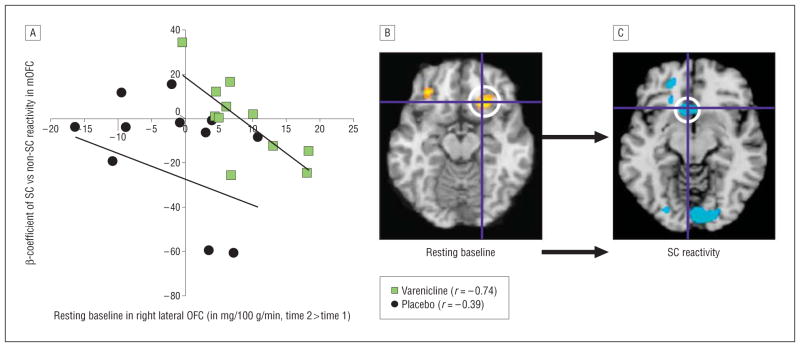
Figure 2.
Resting baseline activity in right lateral orbitofrontal cortex (LOFC) predicted diminished cue responses in medial OFC (mOFC). A, Change scores from time 1 to time 2 of individual perfusion functional magnetic resonance imaging responses (β coefficients) during exposure to smoking cues (SCs) vs non-SCs in the mOFC (x axis) as a function of change scores in resting brain activity in the right LOFC (y axis). Individual “subject” values selected for quantifying LOFC effects were acquired by calculating a mean value from a sphere with a 6-mm radius, its center located at the resting-baseline group data suprathreshold voxel of the activated cluster (coordinates x, y, z, respectively, in Montreal Neurological Institute [MNI] standard brain: 22, 26, −14). B, Three weeks of varenicline resulted in an increase in activity in the right LOFC. Crosshairs are centered on the coordinates of the peak voxel of the cluster. C, Effect of varenicline-induced activation of the right LOFC on the mOFC during SC exposure (coordinates: −6, 20, −10). Data are analyzed and displayed neurologically (left is left) in SPM5 at P=.01 and are overlaid on the MNI standard brain. Activations are significant at P < .001 (uncorrected at the cluster level). Axial slices are shown. “Hot” colors (shades of yellow and orange) represent increases in brain activity, and “cool” colors (shades of blue) represent decreases in brain activity.

