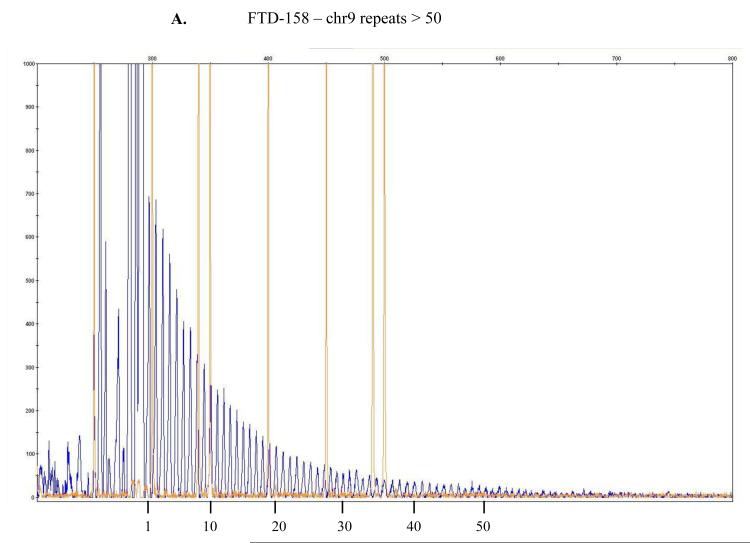
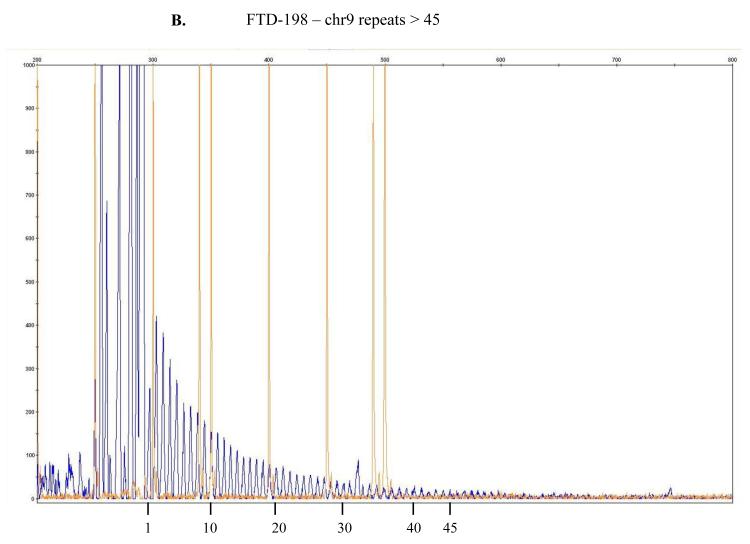
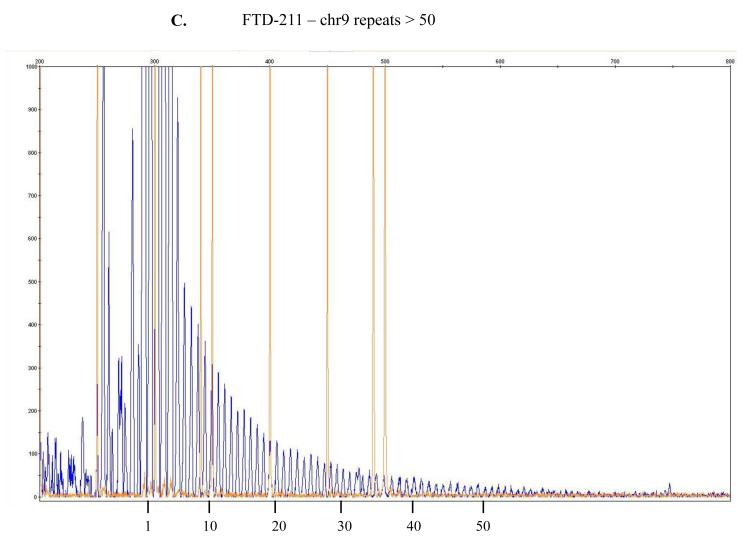
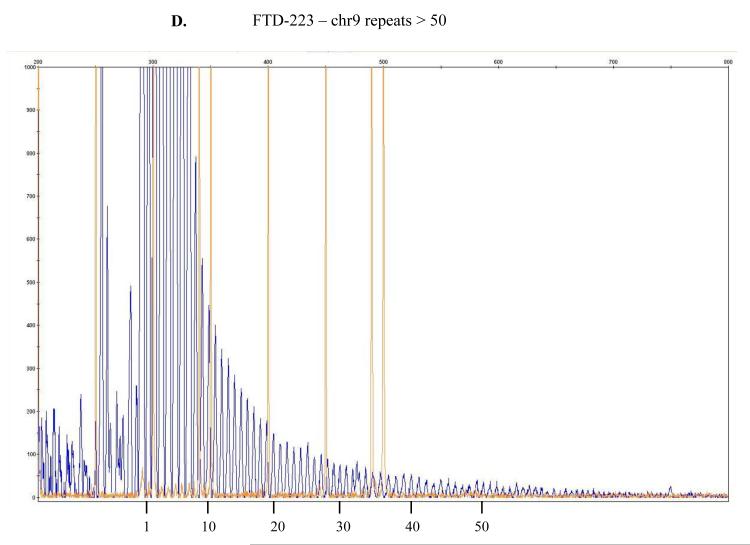
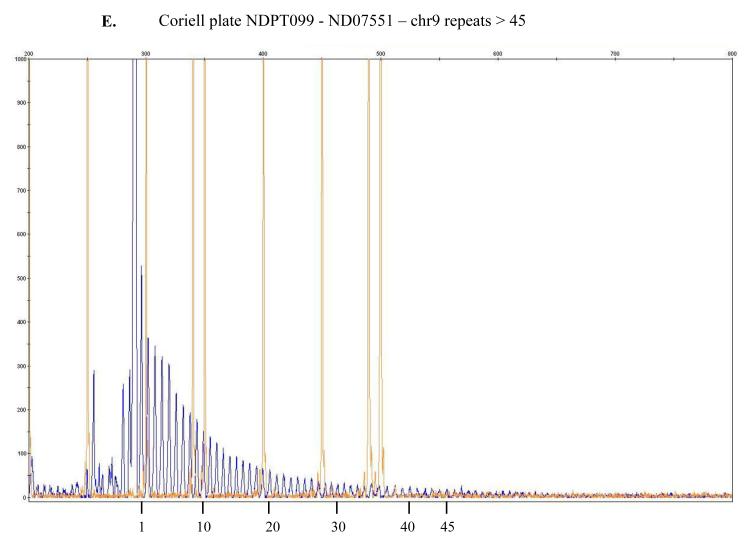
Figure 1.
The repeat-primed PCR reactions were run on ABI3730 DNA Analyzer .The results were analyzed & visualized using Gene Mapper software. Fluorescence intensities are shown in the vertical axis: the size marker is identified by orange vertical lines and the hexanucleotide repeats that extend beyond the 300 bp marker are marked in blue. The range of > 30 repeats is considered the threshold suggesting presence of expansion even though a direct and precise relatedness between this method and the actual repeat size has not been established yet being, as such, simply predictive of probable repeat expansion. In here, counts of approximately > 45 or > 50 repeats are depicted for, respectively, samples FTD-158 (A), FTD-198 (B), FTD-211 (C), FTD-223 (D) and for Coriell neurologically normal control ND07551 (E).

