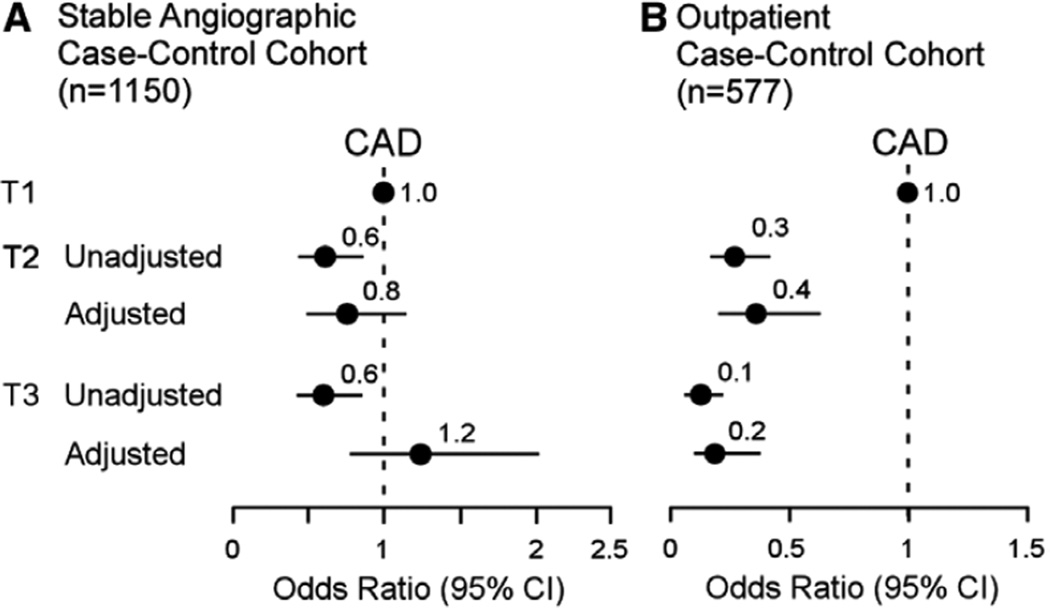
Figure 3.
Forrest plot indicating prevalent coronary artery disease (CAD) risk in stable angiographic and outpatient cohorts. Apolipoprotein B–depleted serum as the cholesterol acceptor in cholesterol efflux assays. A, Relationship between total cholesterol efflux activity and prevalent CAD plotted from low to high tertiles in the angiographic cohort. B, Outpatient cohort. Multilogistic regression model included adjustments for age, sex, smoking, diabetes mel-litus, hypertension, low-density lipoprotein-cholesterol, and high-density lipoprotein-cholesterol levels. Patient sample size (n) is indicated. The 5% to 95% confidence interval (CI) is indicated by line length.

