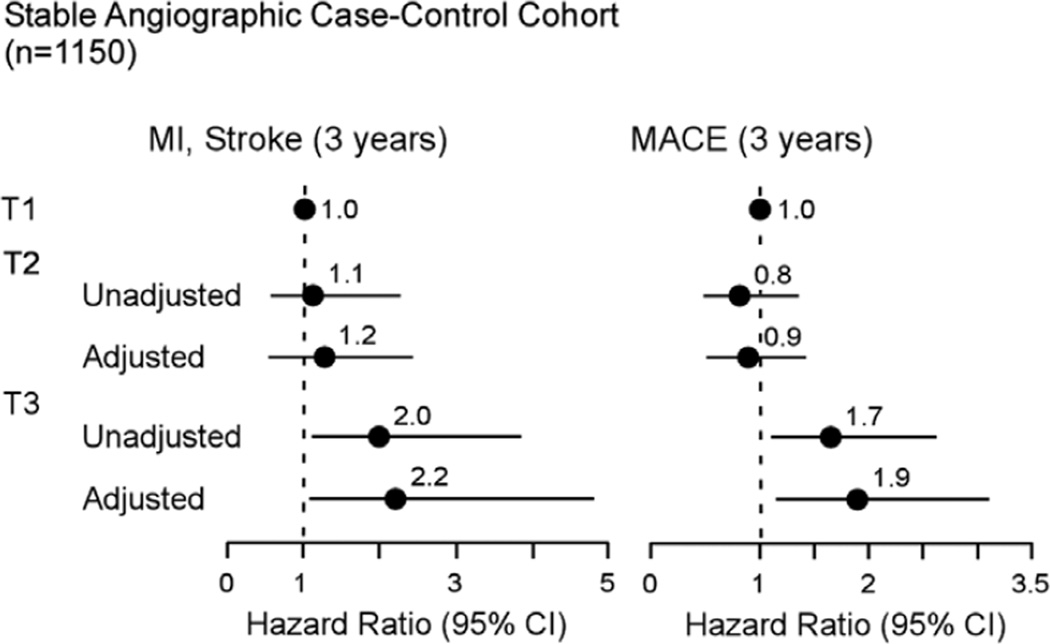
Figure 4.
Forrest plot indicating incident cardiovascular risks for the stable angiographic cohort. Relationship between total cholesterol efflux activity and incident (3 years) risk of myocardial infarction (MI)/stroke (left) or major adverse cardiovascular event (MACE; MI, stroke, or death; right) plotted from low to high tertiles. Multilogistic regression model included either no adjustments or adjustments for age, sex, smoking, diabetes mellitus, hypertension, low-density lipoprotein-cholesterol, and high-density lipoprotein-cholesterol levels as indicated. The 5% to 95% confdence interval (CI) is indicated by line length.

