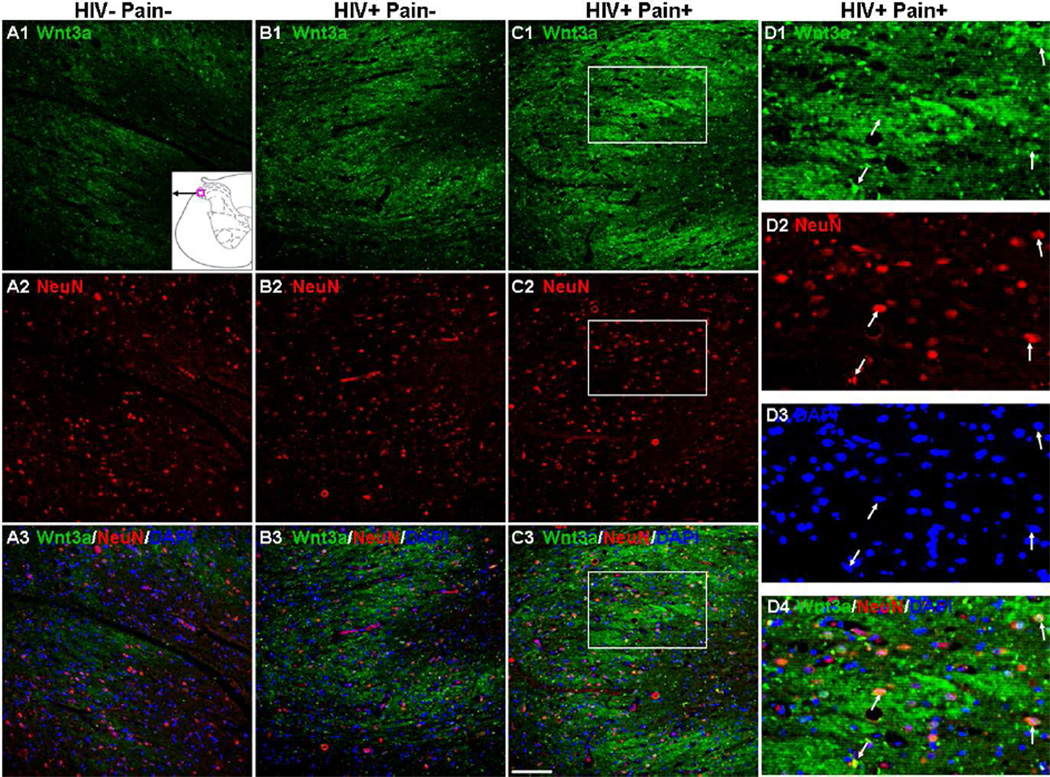
Fig. 3.
Cellular localization of Wnt3a in the SDH. (A1–C3) Double staining of Wnt3a (Green) and NeuN (Red). Staining in the SDH of HIV-negative subjects (A1–A3), ‘pain-negative’ HIV patients (B1–B3), and ‘pain-positive’ HIV patients (C1–C3). Wnt3a staining was mainly observed in NeuN-labeled cell bodies and regions surrounding the cell bodies. The signals were increased in ‘pain-positive’ HIV patients. The region of the micrograph in the SDH is indicated by the red box located at the bottom in A1. (D1–D4) Higher power images of the box regions in (C1–C3). Wnt3a signals partly overlapped with NeuN in the neuronal cell bodies (arrow). Scale bar: 100 µm.

