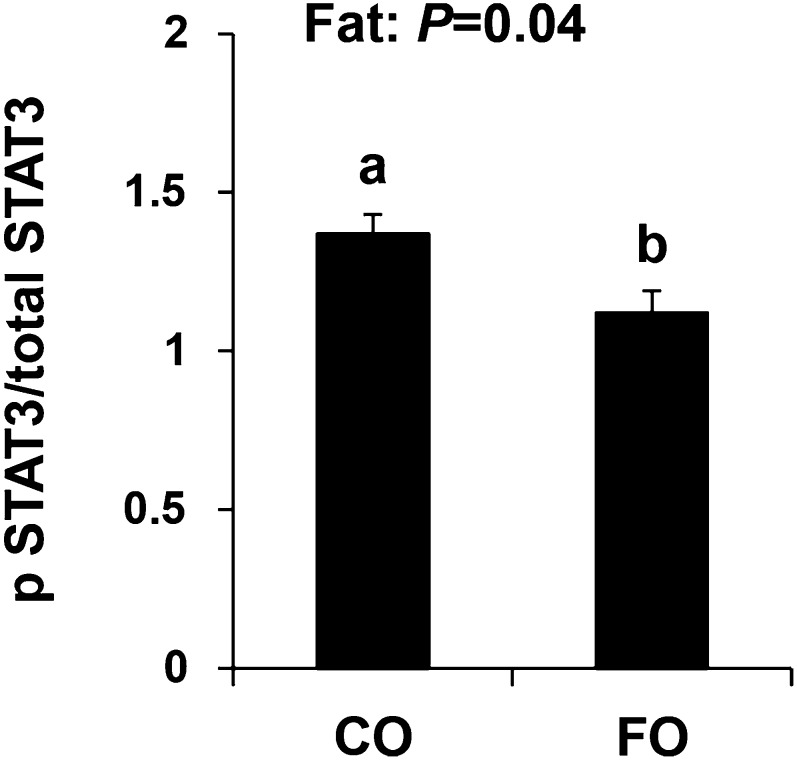
FIGURE 2.
Th17-cell expression of phosphorylated/total STAT3 from mice fed diets containing FO or CO plus cellulose or pectin for 3 wk. Data were analyzed by 2-factor ANOVA (main effects: dietary fat and fiber). Only pooled data from a significant main effect (dietary fat) are shown. Values are means ± SEMs, n = 8/diet. Labeled means without a common letter differ, P ≤ 0.05. CO, corn oil; FO, fish oil. IL, interleukin; pSTAT, phosphorylated signal transducer and activator of transcription; STAT, signal transducer and activator of transcription.

