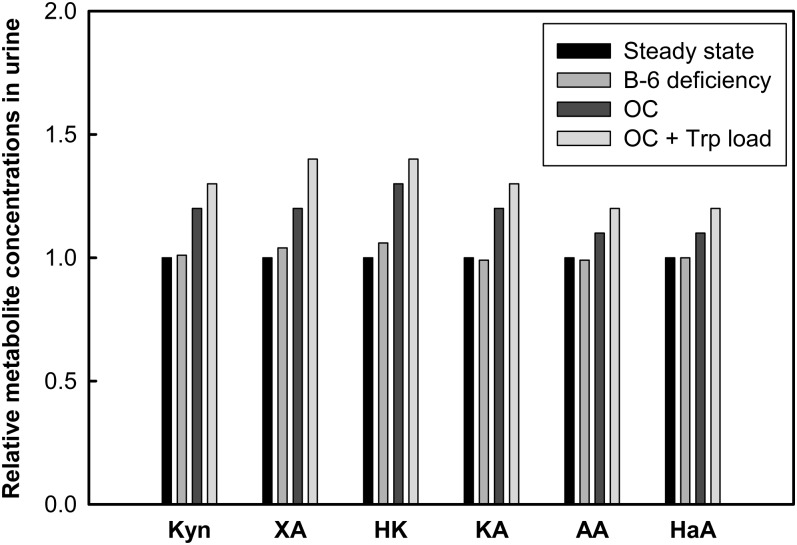
FIGURE 6.
Relative concentrations of tryptophan metabolites after simulation of low vitamin B-6 concentrations, OC use, and tryptophan load test. Vitamin B-6 deficiency was simulated by lowering PLP to 50% of the normal value in the model. OC usage was simulated by inducing TDO activity by 80% and decreasing PLP by 50% of normal value in the model. The trytophan load test was simulated as described in Figure 3. AA, anthranilic acid; HaA, 3-hydroxyanthranilic acid; HK, 3-hydroxykynurenine; KA, kynurenic acid; Kyn, kynurenine; OC, oral contraceptive; PLP, pyridoxal 5′-phosphate; TDO, tryptophan 2,3-dioxygenase; Trp, tryptophan; XA, xanthurenic acid.

