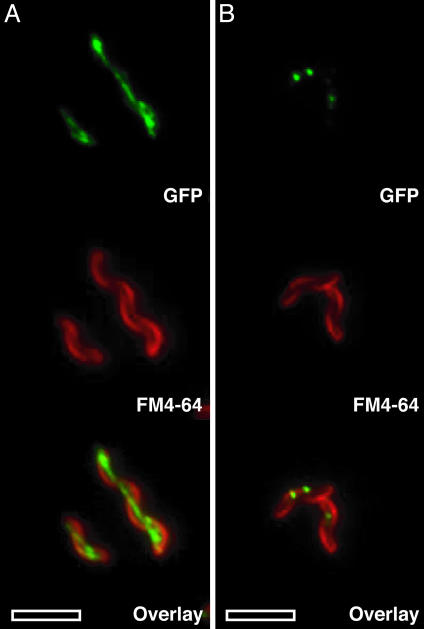
Fig. 4.
MamA displays a dynamic localization during the growth of AMB-1. The top images are the GFP localization, the middle images are the cell membrane stain with FM4-64, and the bottom images are the overlay of the GFP and FM4-64 images. (A) MamA-GFP localizes to a thin line within the cell during the logarithmic growth phase. The localization is from one end of the cell to the other, and at times some membrane localization is also observed. (B) In stationary phase, MamA-GFP displays a punctate pattern with one to four spots within the cell. (Scale bars: 5 μm.)

