Figure 3.
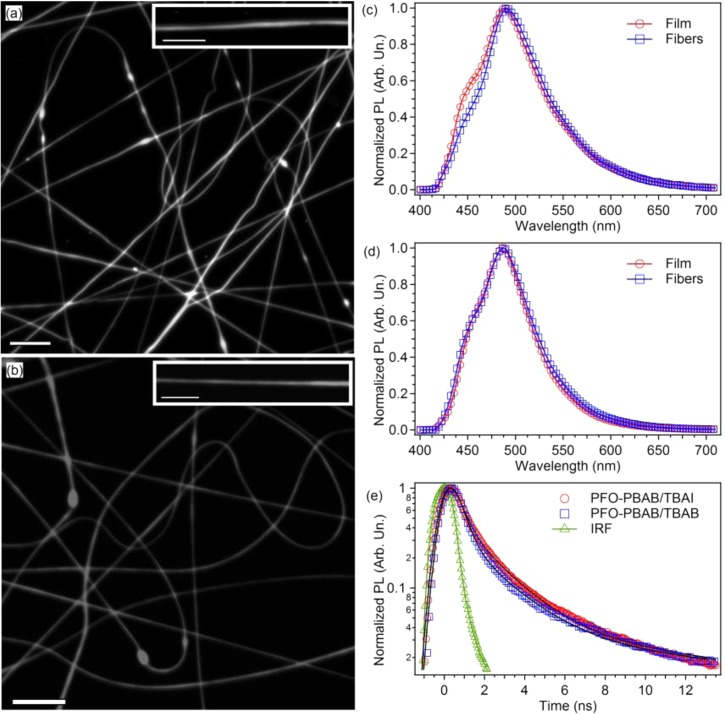
(a, b) Fluorescence confocal micrographs of a mat of PFO–PBAB/TBAI (a) and PFO–PBAB/TBAB (b) fibers (scale bar = 10 μm). Examples of individual light-emitting nanofibers are shown in the corresponding insets (scale bars = 5 μm). (c) PL spectra of PFO–PBAB nanofibers (circles) and films (squares) with TBAI. (d) PL spectra of PFO–PBAB nanofibers (circles) and films (squares) with TBAB. (e) PL temporal decay for PFO-PBAB/TBAI (circles) and PFO–PBAB/TBAB nanofibers (squares). The black continuous lines are the best fit to the data by a sum of three exponential functions convoluted with the IRF (the latter is also shown with triangles).

