
Figure 3.
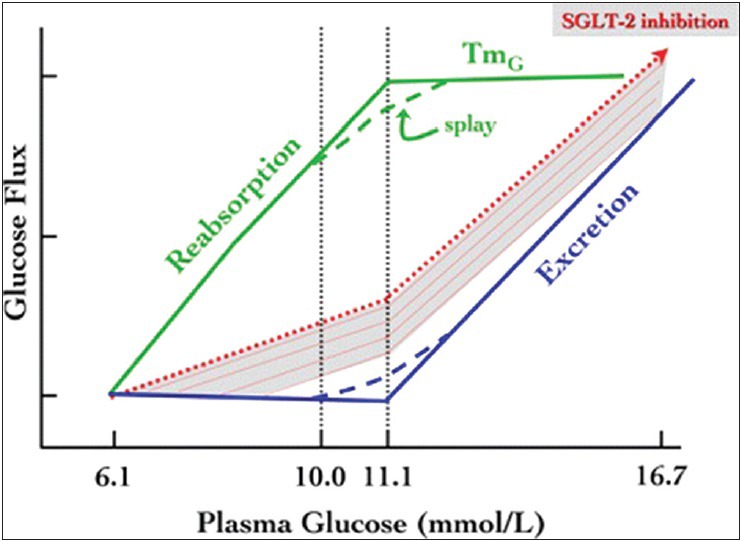
Renal glucose handling. Scheme of normal renal glucose handling, with reabsorption (in green) being complete, and excretion nil (in blue), up to a splayed threshold of plasma glucose concentration. The dotted red line and the underlying shaded area represent the hypothetical displacement of the excretion function when glucose reabsorption is reduced by SGLT2 inhibition. TmG, maximal transport rate for glucose. Adapted with permission from Ref[22]