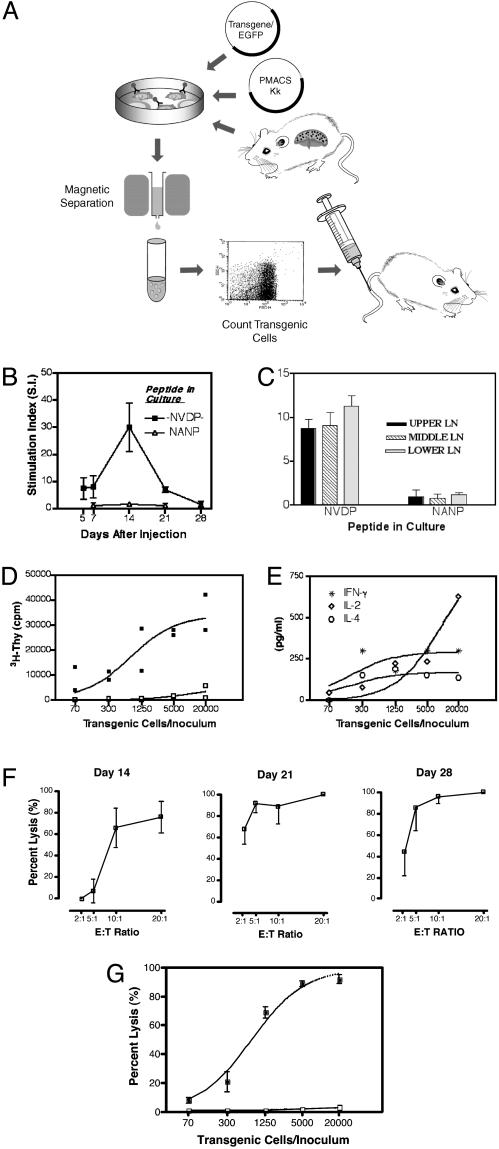
Fig. 1.
(A) The process of spontaneous transgenesis and immunization with transgenic lymphocytes. Details of the two procedures are described in Materials and Methods. (B) The characteristics of the primary CD4 T cell response: kinetics and specificity. C57BL/6 mice were injected with 5 × 10³ γ1NV2NA3 transgenic cells. Spleen cells were harvested at different time points and tested in a T cell proliferation assay. Tests were run in triplicate. Values represent the mean stimulation index ± SD of four mice per group (24). The cpm at each time point are as follows: day 5, NVDP peptide (11,581)/medium alone (1,988); day 7, NVDP peptide (40,016)/medium alone (4,932); day 14, NVDP peptide (29,856)/medium alone (1,165); day 21, NVDP peptide (15,788)/medium alone (2,322); and day 28, NVDP peptide (1,014)/medium alone (732). (C) T cell proliferation in lymph nodes (LNs). Fourteen days after injection LNs were collected from the upper, middle, and lower body anatomical regions. The cpm per each group are as follows: upper LN, NVDP peptide (10,576)/NANP peptide (1,201); middle LN, NVDP peptide (10,236)/NANP peptide (1,130); and lower LN, NVDP peptide (9,786)/NANP peptide (887). Spleen cells in the same experiment (data not shown) were NVDP peptide (14,505)/NANP peptide (1,022). (D) Dose-response of CD4 T cell induction. Mice (two per group) were injected with lymphocytes transgenic for γ1NV2NA3 (▪) or γ1NANP (□) as a control, with varying numbers (20,000-70) of transgenic cells. Mice were killed on day 14, and spleen CD4 T cells were restimulated in vitro with the -NVDP- peptide. Proliferation is expressed as cpm. Two independent experiments yielded a similar result. (E) Cytokine production vs. immunizing dose. Culture supernatants from the experiment depicted in D were analyzed for cytokine content (pg/ml). (F) The CD8 T cell response: phase of induction and kinetics after injection of 5 × 10³ γ1NV2NP3 transgenic cells. Spleen cells were harvested at the time points indicated, restimulated in vitro with peptide NP366-374 (5 μg/ml), and tested in a standard 51Cr-release assay using EL-4 cells pulsed with NP366-374 as target at various effector-to-target cell ratios. Results are expressed as the percentage of specific lysis. (G) Dose-response of CTL induction. Groups of three mice each received a single injection of varying numbers (20,000-70) of transgenic cells. Mice were killed on day 14, and the CTL response was measured by using EL-4 cells pulsed with NP366-374 (filled symbols) or EL-4 alone (open symbols) as targets.

