
Figure 1.
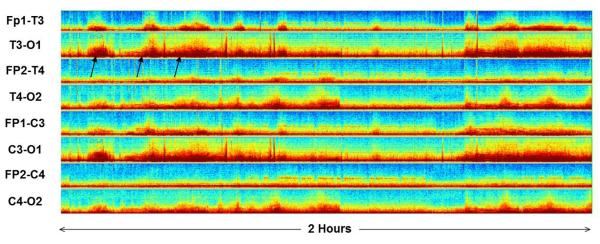
Two hours of CDSA EEG is shown for eight channels using a double-distance bipolar montage. In each channel, most of the power (red) is in the low frequencies on the Y-axis consistent with diffuse delta activity. Superimposed are intermittent red arches which build from low frequency to a higher frequency. Sometimes these fade back to a low frequency and sometimes they abruptly drop back to a low frequency. These are consistent with electrographic seizures which evolve in frequency and amplitude and then either abruptly or slowly terminate. The initial three seizures are marked with black arrows.