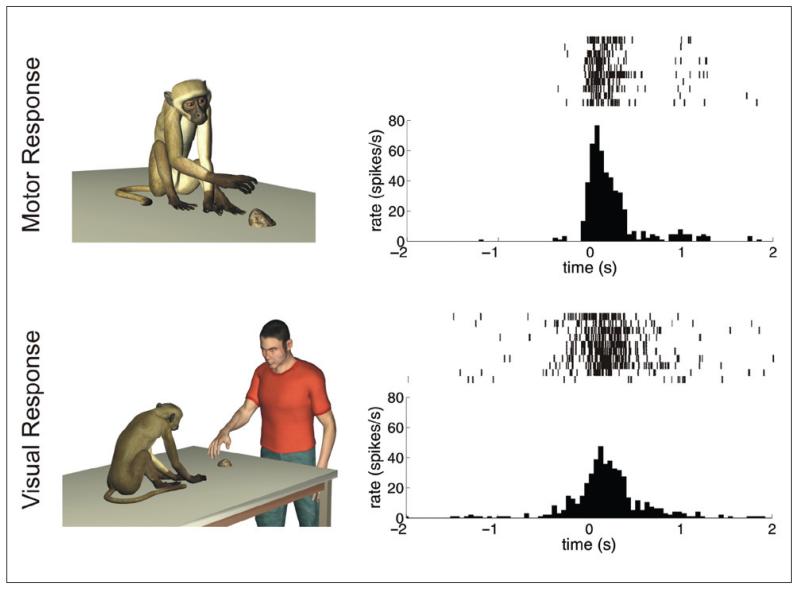
Figure 2.
Response properties of a mirror neuron. Each row in the left column schematically represents the experimental condition. The panels in the right column show the corresponding responses of the same neuron in the form of a raster plot (upper part) and peri-stimulus spike density (bottom part). (top row, right panel) Response of a neuron during active goal-directed motor acts of the monkey (e.g., grasping small objects of different shapes). (bottom row, right panel) Response of the same neuron during the observation of the same goal-directed motor acts performed by the experimenter. In the two raster plots, each vertical bar signifies the occurrence of an action potential, and different lines refer to different trials. In both figures, time t = 0 represents the moment of contact between the monkey’s (top panel) or experimenter’s (bottom panel) hand with the goal object.

