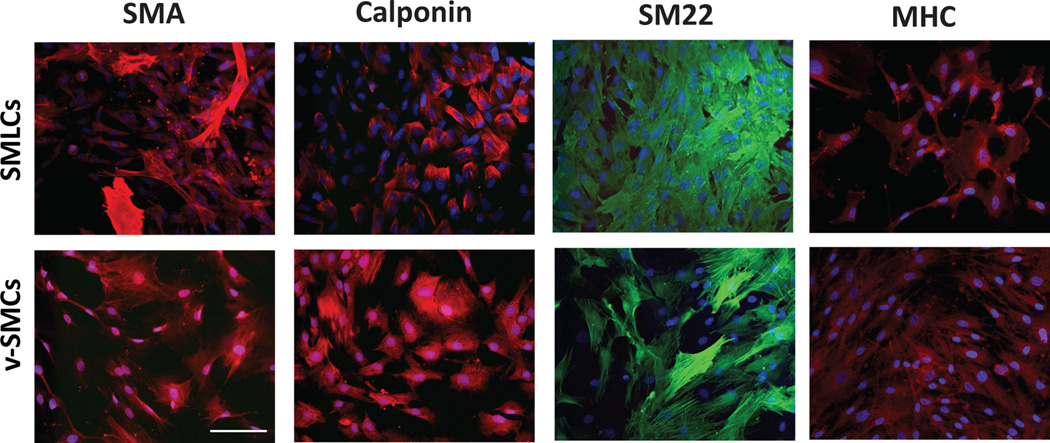
Figure 3.
Comparison of hESC-derived SMLCs and control vSMCs. Comparative immunofluorescence analysis demonstrates the expression of specific SMC markers such as SMA, calponin, SM22, and SM-MHC. Scale bar is 100 µm. Reproduced with kind permission from Springer Science and Business Media [51].

