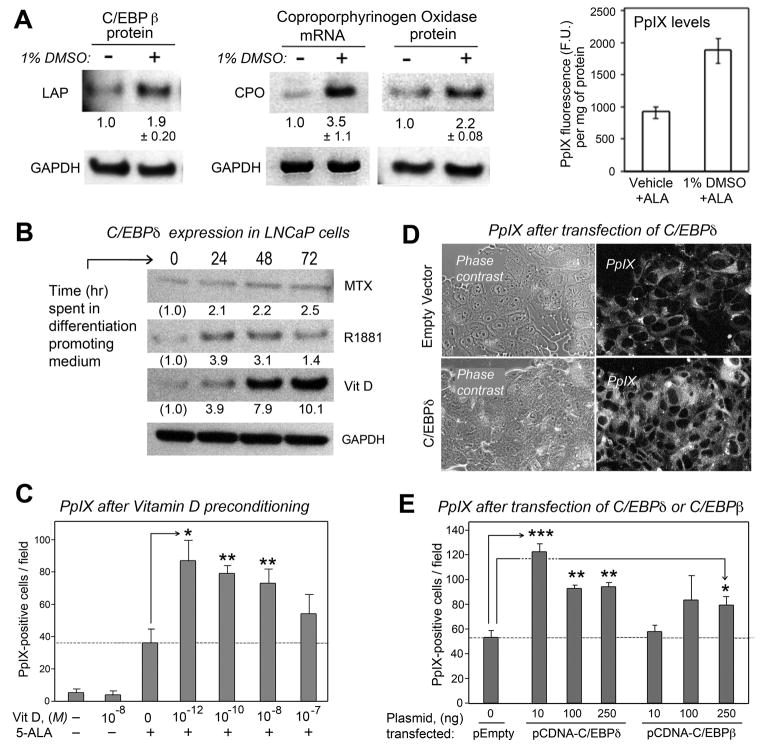
Figure 2. C/EBP transcription factors, the CPO enzyme, and PpIX are increased in parallel in cells undergoing differentiation.
(A), Correlation between C/EBPβ expression, CPO expression, and PpIX accumulation in MEL cells after 24 hr in medium with 1% DMSO. (Left panel), C/EBPβ (LAP) is increased in DMSO-treated MEL cells. (Middle panel), CPO mRNA and CPO protein levels are increased in DMSO-treated MEL cells, by semi-quantitative RT-PCR and Western analyses, respectively. Numbers beneath the lanes indicate relative band intensities by densitometry (mean ± half-range of 2 independent experiments). (Right panel), Graph showing relative increase in PpIX levels (arbitrary fluorescence units, F.U.) in MEL cells after a 4 hr incubation in 1 mM ALA; measurement described in Methods. Data are mean ± SD of 3 experiments. (B) Western analyses of LNCaP cells exposed for 72 hr to methotrexate (MTX, 1 μg/ml), the androgen R1881 (10−7 M), or calcitriol (Vit D3, 10−7 M), and probed with antisera to C/EBPδ, or to GAPDH for calcitriol treated cultures. Numbers beneath the lanes indicate fold-induction by densitometry. (C) PpIX expression as measured in LNCaP cultures, following incubation of the cells for 72 hr in calcitriol at the concentrations indicated (M, molar) and then for an additional 4 hr in 1mM ALA. Relative changes in PpIX were measured by analysis of digital confocal images as described in Methods. (D) PpIX levels are increased in cells overexpressing C/EBP transcription factors. Digital confocal images of LNCaP cultures transfected with a C/EBPδ expression vector, or with an empty expression vector, to illustrate increased PpIX expression in C/EBPδ-transfected cultures (lower right panel). (E) Quantitation of relative PpIX expression levels in C/EBPδ- or C/EBPβ-transfected LNCaP cells. Means ± S.D. of 3 dishes per point. Asterisks: Two-sided t-test, (*), p < 0.01; (**), p< 0.005; (***), p < 0.0001.

