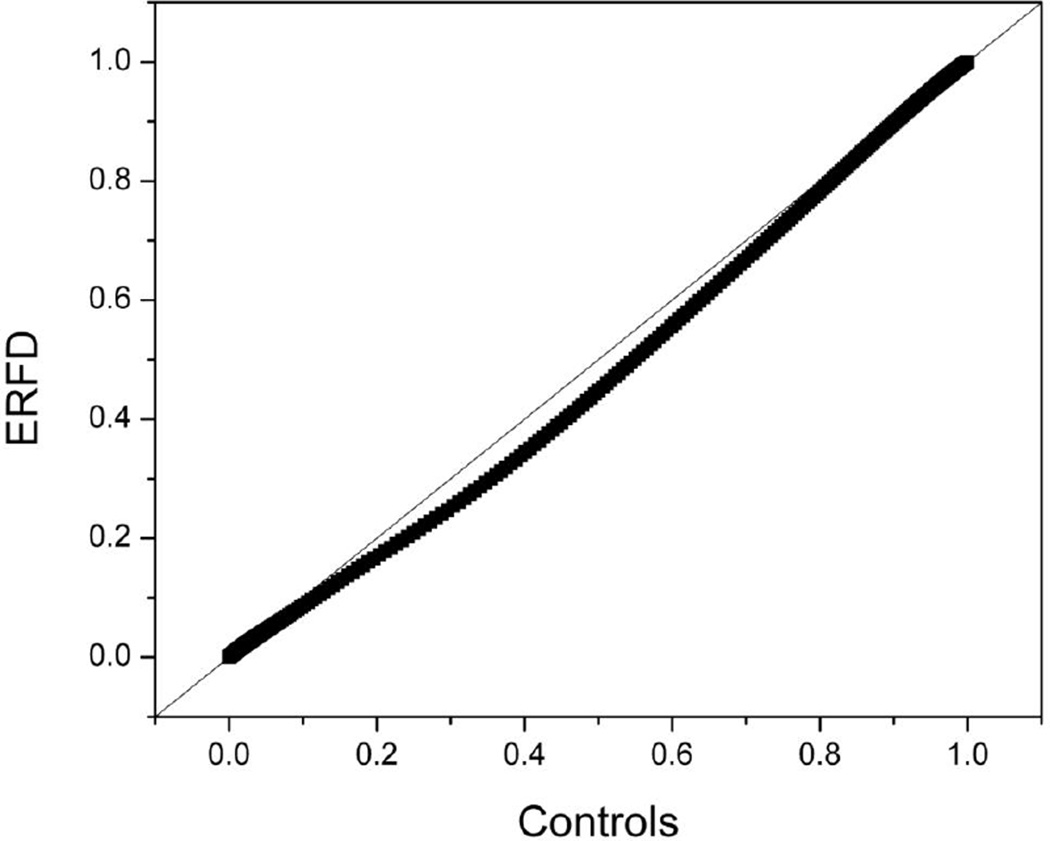
Figure 3. Quantile-quantile plot comparing the control group thermogram and the ERFD group thermogram.
The 45° line shows indicates where the data should fall if there is no difference between the groups. The experimental data do not fall on this line, indicating that differences exist between the control and ERFD thermograms.

