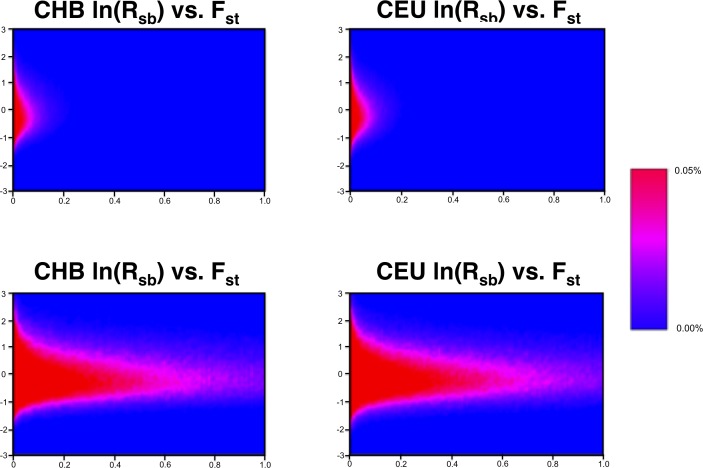
Figure 2.
Joint distribution of ln(Rsb) and Fst for genome-wide SNPs. Heat maps indicating the density of the positive selection measures for 1,108,091 autosomal SNPs in the CEU and CHB populations. Top: distribution across the full range of Fst values. Bottom: distribution zoomed in on Fst values between 0.0 and 0.1.

