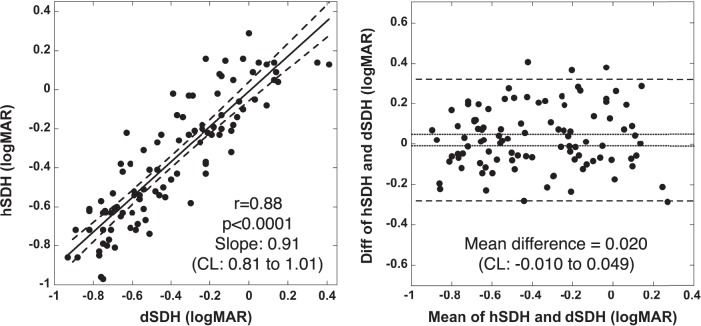
Figure 2. .
Left: Correlation of hSDH and dSDH testing protocols. The solid line is the linear regression. The dashed lines represent the band of 95% CI of the linear regression. Right: Bland-Altman analysis of hSDH and dSDH testing protocols. The dotted horizontal lines represent the 95% CI of the mean difference. The dashed horizontal lines represent the mean difference of ±1.96 SD.

