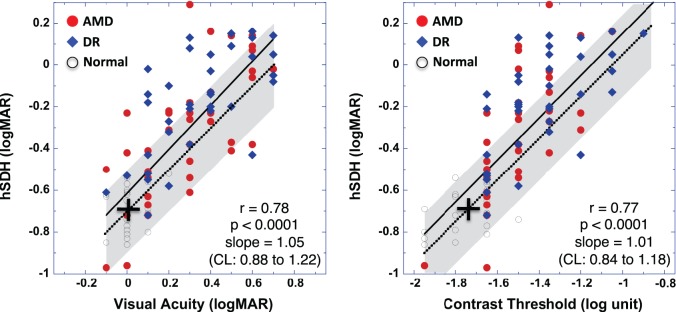
Figure 3. .

Correlation of hSDH with VA (left) or with CS (right) for data obtained from the visually normal subjects (open circles), AMD (closed red circles), and DR (closed blue diamonds) groups. The solid lines represent the linear fit for all data points. The cross indicates a point at the normal mean hSDH (−0.69 logMAR) and the normal mean VA (0.02 logMAR) (left) or the normal mean CS (−1.72 log unit) (right). The dotted lines go through the normal mean points (crosses) and have a slope of 1. The shaded area indicates a range of ±0.20 logMAR (estimated 95% CI) from the dotted line along both the vertical and horizontal axes.
