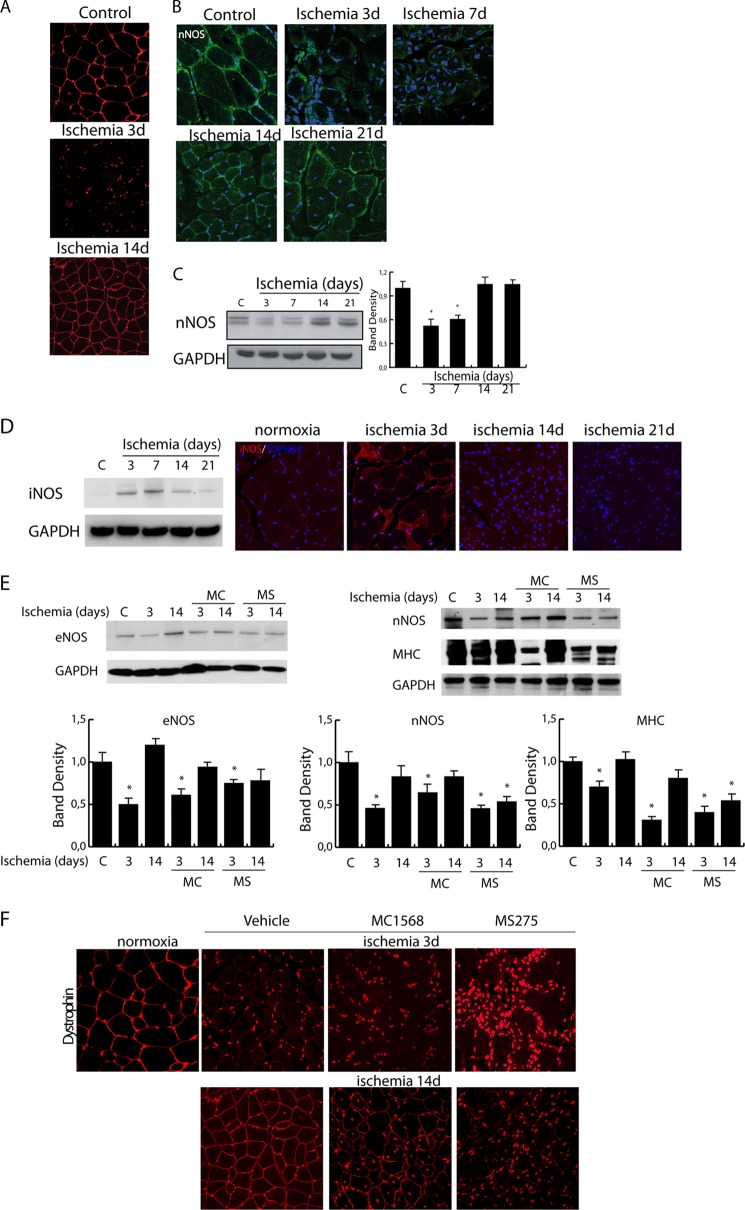
FIGURE 2.
A, representative images of dystrophin expression (red) in control and post-ischemic muscle at 3 and 14 days. Nuclei were stained with TOPRO3 (red). Magnification, ×40. B and C, analysis of nNOS expression in control and ischemic muscles by confocal microscopy (B; magnification, ×63) and Western blotting (C). Nuclei were stained with TOPRO3 (blue). The graph shows the relative level of nNOS normalized to loading control (GAPDH). *, p < 0.05 versus control. D, evaluation of iNOS expression in control and ischemic muscles at 3, 7, 14, and 21 days by Western blotting and confocal microscopy. E and F, evaluation of eNOS and nNOS (E) and dystrophin (F) in ischemic muscles from control (vehicle) and MC1568- or MS275-treated mice at 3 and 14 days after ischemia. Error bars, S.E. AU, arbitrary units.

