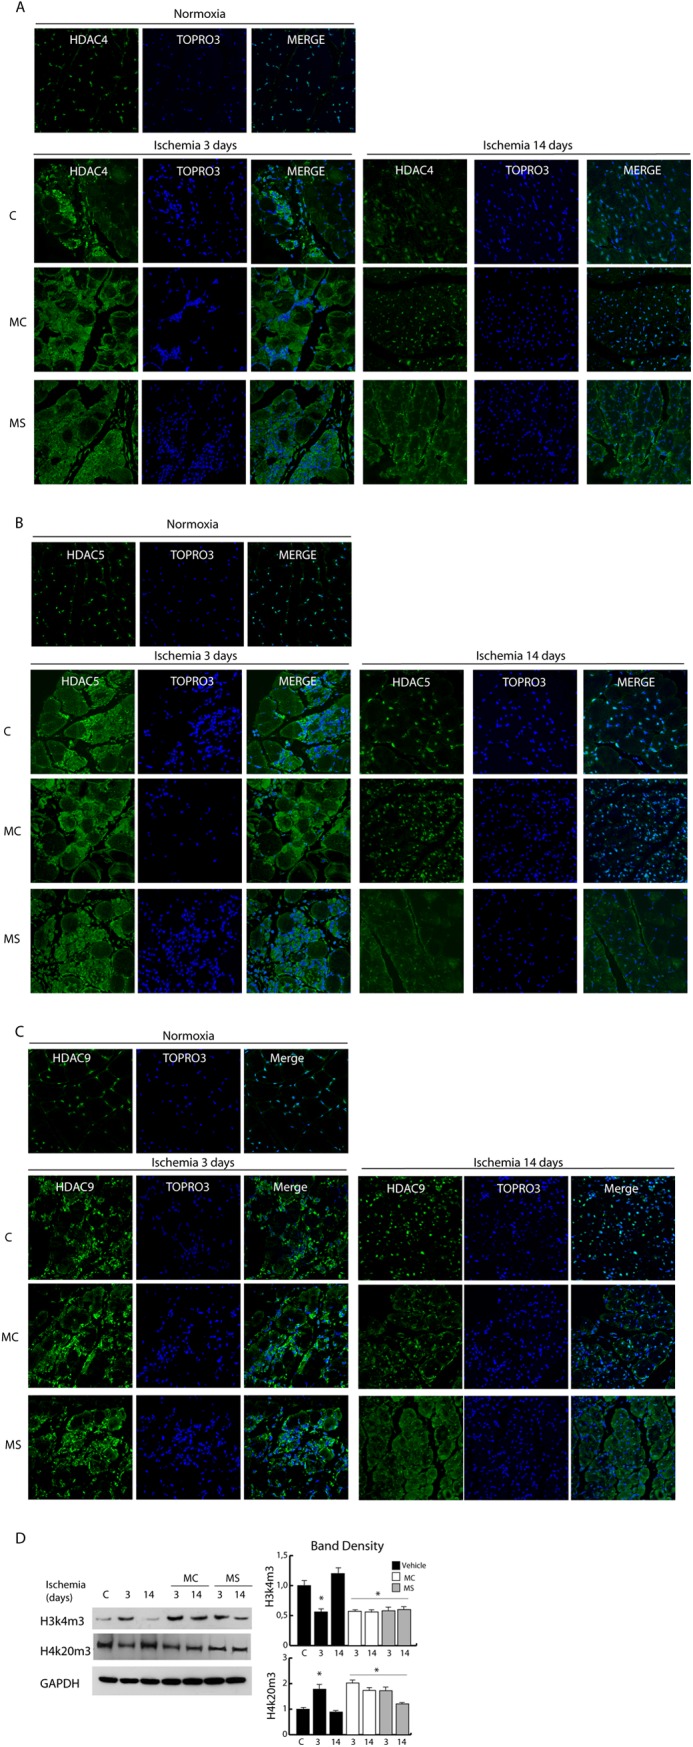
FIGURE 8.

Evaluation of class I- and class IIa-selective DIs on class IIa HDAC nuclear export. A–C, confocal analysis of HDAC4 (A), HDAC5 (B), and HDAC9 (C) distribution (green) in control and post-ischemic adductor muscles at 3 and 14 days in untreated or MC- or MS-treated mice. Nuclei were counterstained with TOPRO3. D, Western blots of histone modifications (H3K4m3, H3K20m3) in control and ischemic muscles at 3 and 14 days of untreated or MC- or MS-treated mice. Band densities are shown in the right panels. *, p < 0.05 versus control. Error bars, S.E.
