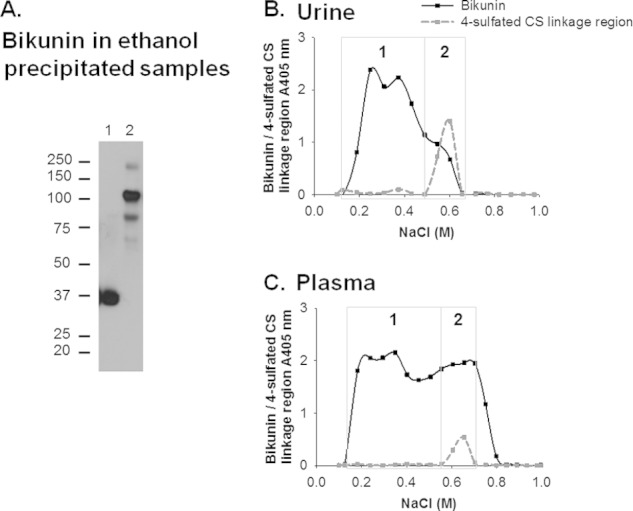
FIGURE 2.

A, Western blot analysis of bikunin in ethanol-precipitated urine (lane 1) and plasma (lane 2). The presence of bikunin and 4-sulfated CS linkage regions in proteoglycan-enriched fractions of urine (B) and plasma (C) separated by anion exchange chromatography with a linear elution gradient of 0.1–1.0 m NaCl is shown. The fractions that were analyzed are denoted by the dots on the curves representing the absorbance of fractions analyzed for the presence of bikunin and 4-sulfated CS linkage regions and assigned their average NaCl concentration. The fractions in the boxed region denoted “1” were pooled and subsequently termed fraction 1, and similarly, the fractions in the boxed region denoted “2” were pooled and subsequently termed fraction 2.
